. 2025 May;26(9):2378-2412.
doi: 10.1038/s44319-025-00426-4. Epub 2025 Mar 20.

Lack of AtMC1 catalytic activity triggers autoimmunity dependent on NLR stability

Affiliations

Lack of AtMC1 catalytic activity triggers autoimmunity dependent on NLR stability

Jose Salguero-Linares et al. EMBO Rep. 2025 May.

Abstract

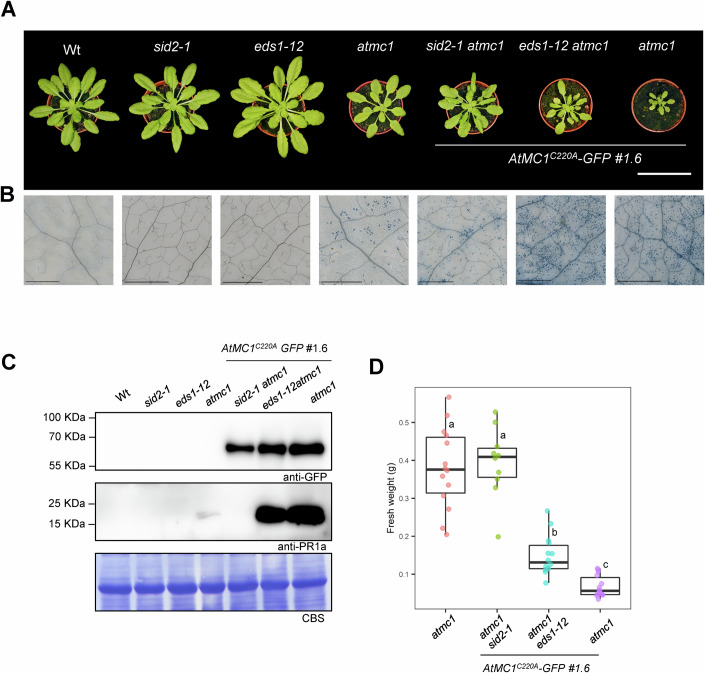
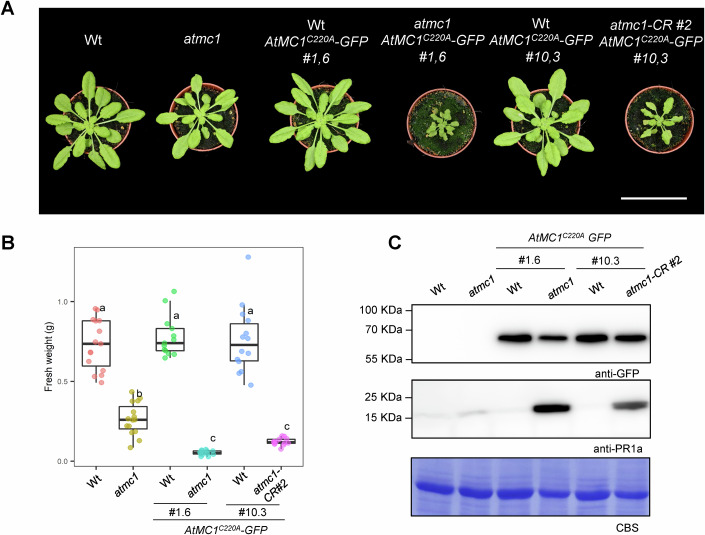
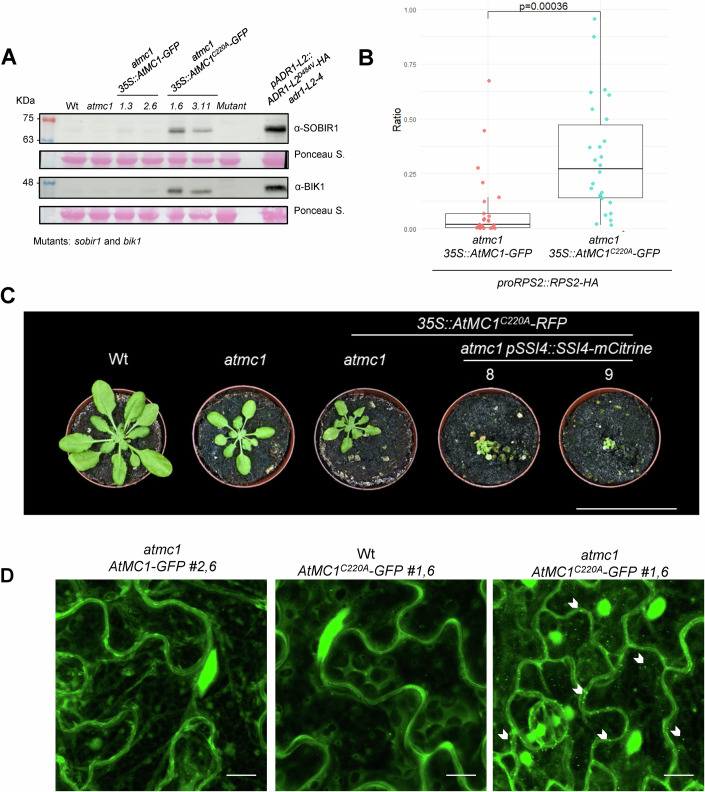
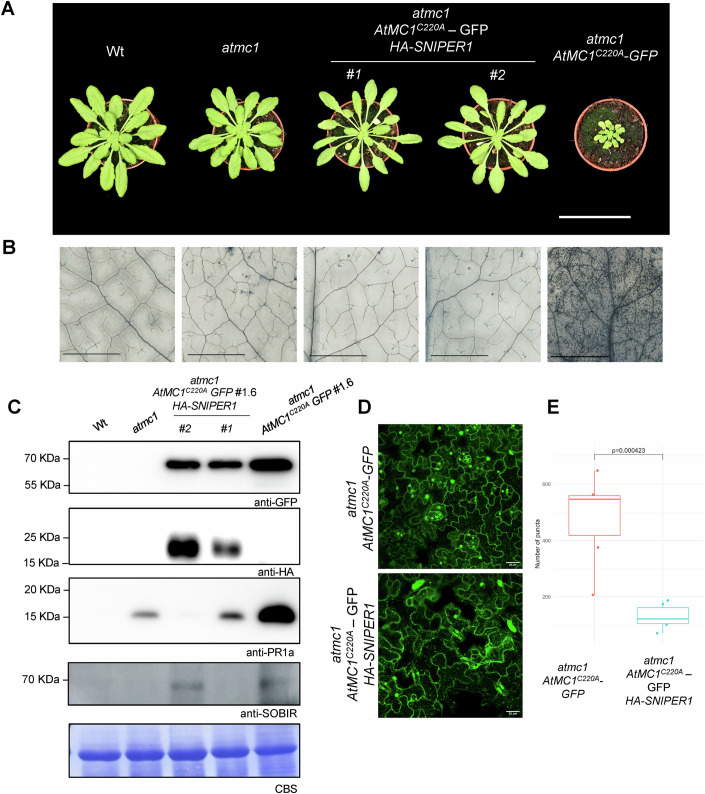
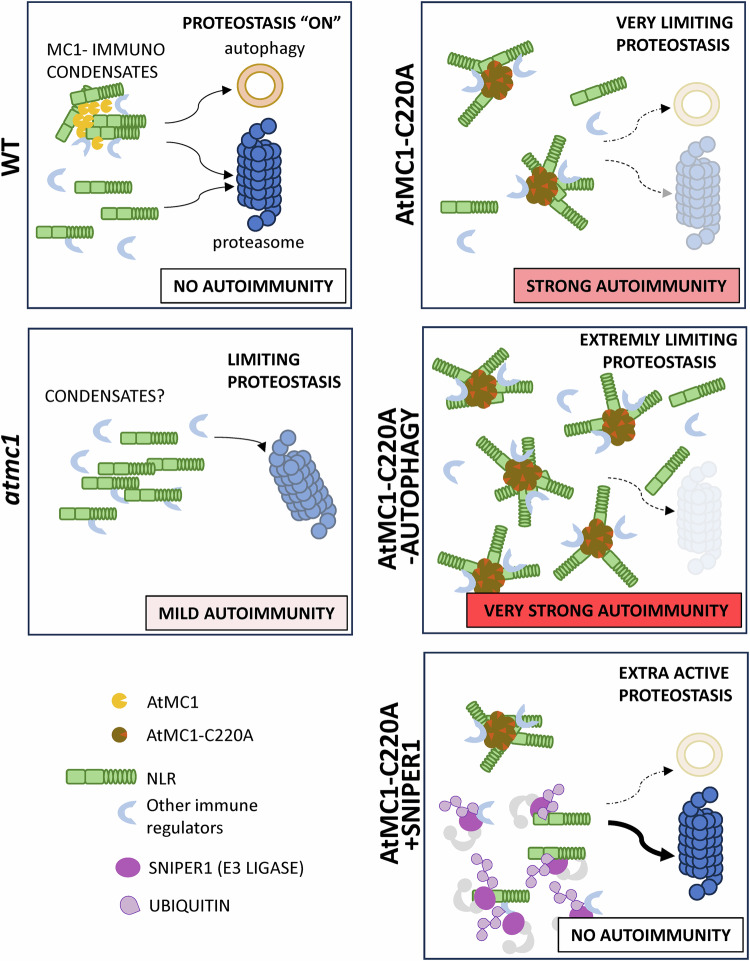
Plants utilize cell surface-localized pattern recognition receptors (PRRs) and intracellular nucleotide-binding leucine-rich repeat (NLR) receptors to detect non-self and elicit robust immune responses. Fine-tuning the homeostasis of these receptors is critical to prevent their hyperactivation. Here, we show that Arabidopsis plants lacking metacaspase 1 (AtMC1) display autoimmunity dependent on immune signalling components downstream of NLR and PRR activation. Overexpression of a catalytically inactive AtMC1 in an atmc1 background triggers severe autoimmunity partially dependent on the same immune signalling components. Overexpression of the E3 ligase SNIPER1, a master regulator of NLR homeostasis, fully reverts the AtMC1-dependent autoimmunity phenotype, inferring that a broad defect in NLR turnover may underlie the severe phenotype observed. Catalytically inactive AtMC1 localizes to punctate structures that are degraded through autophagy. Considering also previous evidence on the proteostatic functions of AtMC1, we speculate that Wt AtMC1 may either directly or indirectly control NLR protein levels, thereby preventing autoimmunity.

Keywords: Autoimmunity; Autophagy; Condensates; Metacaspases; Proteostasis.


Conflict of interest statement

Disclosure and competing interests statement. The authors declare no competing interests.

Figures

Figure 1
Figure 1. Absence of AtMC1 results in mild autoimmunity.
(A) Volcano plot analysis of leaf proteome. Corrected p-value < 0.05 and log2 fold-change >1 for wild-type protein content (red dots) or <−1 for atmc1 protein content (blue dots). Grey-coloured dots represent insignificant values (p ≥ 0.05) and/or ≥−1 log2 fold-change ≤1. Statistical analysis was done using a two-tailed unpaired Student’s t test (n = 5 biological replicates per genotype per condition). Labelled dots correspond to proteins related to plant immunity. (B) Dot plot of gene ontology term showing the enriched pathways at the p-value < 0.05 significance level. Colours indicate the p-values from Fisher’s exact test, Bonferroni corrected, and the dots’ size is proportional to the number of differentially accumulated proteins in the given pathway. On top GO terms corresponding to wild-type significant proteins, and on the bottom, for atmc1. Source data are available online for this figure.
Figure 2
Figure 2. Overexpression of catalytically inactive AtMC1 in an atmc1 background leads to severe autoimmunity.
(A) Scheme of AtMC1 and catalytically inactive AtMC1 (AtMC1C220A) proteins fused to GFP. The prodomain, p20 and p10 domains are indicated. The catalytic cysteine (C220) is also indicated. (B) Representative images of 40-day-old plants with the indicated genotypes grown under short day conditions. Two independent homozygous stable transgenics expressing either AtMC1-GFP (#1.3 and #2,6) or AtMC1C220A-GFP (#1.6 and #3.11) under the control of a 35S constitutive promoter in the atmc1 mutant background are shown. Scale bar = 5.5 cm. (C) Trypan blue staining of an area belonging to the 6th true leaf of the plants shown in (B). Scale bar = 0.5 mm. (D) Total protein extracts from the plants shown in (B) were run on an SDS-PAGE gel and immuno-blotted against the indicated antisera. Coomassie Blue Staining (CBS) of the immunoblotted membranes shows protein levels of Rubisco as a loading control. (E) Plant fresh weight of genotypes shown in (A) (n = 12). Different letters indicate statistical difference in fresh weight between genotypes (one-way ANOVA followed by post hoc Tukey, p value < 0.05). In box plot, the centre line indicates the median, the bounds of the box show the 25th and 75th percentiles, the whiskers indicate minimum to maximum values. Source data are available online for this figure.
Figure 3
Figure 3. Autoimmunity caused by catalytically inactive AtMC1 is partially dependent on SA synthesis and EDS1.
(A) Representative images of 40-day-old plants with the indicated genotypes grown under short day conditions. Scale bar = 5.5 cm. (B) Trypan blue staining of an area belonging to the 6th true leaf of the plants shown in (A). Scale bar = 0.5 mm. (C) Total protein extracts from the plants shown in (A) were run on an SDS-PAGE gel and immuno-blotted against the indicated antisera. Coomassie Blue Staining (CBS) of the immunoblotted membranes shows protein levels of Rubisco as a loading control. (D) Plant fresh weight of genotypes shown in (A) (n = 12). Different letters indicate statistical difference in fresh weight between genotypes (one-way ANOVA followed by post hoc Tukey, p value < 0.05). In box plot, the centre line indicates the median, the bounds of the box show the 25th and 75th percentiles, the whiskers indicate minimum to maximum values. Quantification of fresh weight from Wt (Col-0), sid2-1 and eds1-12 were excluded from the fresh weight graph to better appreciate statistical differences between genotypes of interest. Source data are available online for this figure.
Figure 4
Figure 4. Endogenous Wt AtMC1 alleles suppress the autoimmune phenotype caused by catalytically inactive AtMC1.
(A) Representative images of 40-day-old plants with the indicated genotypes grown under short day conditions. Scale bar = 5.5 cm. (B) Plant fresh weight of genotypes shown in (A) (n = 12). Different letters indicate statistical difference in fresh weight between genotypes (one-way ANOVA followed by post hoc Tukey, p value < 0.05). In box plot, the centre line indicates the median, the bounds of the box show the 25th and 75th percentiles, the whiskers indicate minimum to maximum values. (C) Total protein extracts from the plant genotypes shown in (A) were run on an SDS-PAGE gel and immuno-blotted against the indicated antisera. CBS of the immunoblotted membranes shows protein levels of Rubisco as a loading control. Source data are available online for this figure.
Figure 5
Figure 5. Inactive AtMC1 is enriched in microsomes.
(A) Fractionation assays from 40-day-old plant extracts with the indicated plant genotypes. Total (T), Soluble (S, cytoplasmic proteins) and Microsomal (M, total membranes) fractions were run on an SDS-PAGE gel and immunoblotted against the indicated antisera. Anti-cAPX and anti-H+ATPase were used as cytosol and membrane markers, respectively, to evaluate the success of fractionation. Red arrow shows levels of AtMC1. Black arrow shows cAPX levels. Coomassie Blue Staining (CBS) of the immunoblotted membranes shows protein levels of Rubisco as a loading control. This experiment was repeated twice with similar results. (B) Volcano plot of normalized abundances (label-free quantification (LFQ), log2 scale) for proteins that immunoprecipitated with AtMC1C220A–GFP when expressed in either an atmc1 mutant background (red) or a Wt background (blue) (Student´s t-test p-value < 0.05 and Log2FC > 1). The IPMS analysis was performed on samples collected in n = 4 independent biological replicates. (C) NLRs, and immune components involved in PTI that immunoprecipitated with AtMC1C220A–GFP in atmc1 AtMC1C220A–GFP autoimmune plants and that were selected for further studies. Source data are available online for this figure.
Figure 6
Figure 6. Catalytically inactive AtMC1 interacts in planta with NLRs, and immune components involved in PTI.
(A, B) IP of Arabidopsis transgenics overexpressing atmc1 35S::AtMC1-GFP, atmc1 35S::AtMC1C220A-GFP and proRPS2::RPS2-HA (F2 generation) (A), proSSI4::SSI4-mCherry-FLAG (T1 generation) (B). The indicated constructs were immunoprecipitated with anti-GFP magnetic beads (IP GFP). Protein inputs from protein extracts before IP (INPUTS) and eluates from IPs were run on an SDS-PAGE and immunoblotted with the indicated antibodies. (C) AtMC1C220A-GFP was immunoprecipitated (IP: GFP) from extracts of transgenic Arabidopsis overexpressing AtMC1C220A-GFP in either an atmc1 mutant or wild-type (Wt) background. Inputs and eluates were analysed by SDS-PAGE and immunoblotted with anti-SOBIR1 antibody. Coomassie Blue Staining (CBS) of the immunoblotted membranes shows protein levels of Rubisco as a loading control in the inputs. Source data are available online for this figure.
Figure 7
Figure 7. Immune components homeostasis is altered in atmc1 AtMC1C220A-GFP.
(A) Total protein extracts from the indicated genotypes were run on an SDS-PAGE gel and immune-blotted with the indicated antisera. On the upper blot the mutant corresponds to sobir1, whilst on the lower blot to bik1. Ponceau staining of the immunoblotted membranes shows protein levels of Rubisco as a loading control. (B) Box plot representing the ratio of RPS2-HA protein accumulation in the indicated genotypes. The ratio RPS2::loading control was calculated using ImageJ by analysing the band intensity of anti-HA accumulation in relation to the loading control of each sample. Protein western-blots are found in Appendix Fig. S8 (n = 25). P-value was calculated using a two-tailed unpaired Student’s t test. In box plot, the centre line indicates the median, the bounds of the box show the 25th and 75th percentiles, the whiskers indicate minimum to maximum values. (C) Representative images of 40-day-old plants with the indicated genotypes grown under short day conditions. Scale bar = 5.5 cm. (D) Representative confocal microscopy images from the leaf epidermis of 40-day-old plants grown under short day conditions with the indicated genotypes. Images represent a Z-stack of 18 images taken every 1 μm. Arrows indicate some of the puncta structures formed when AtMC1C220A is overexpressed in an atmc1 mutant background. Scale bar = 10 μm. Source data are available online for this figure.
Figure 8
Figure 8. Catalytically inactive AtMC1 puncta are degraded through autophagy.
(A) Representative single-plane confocal microscopy images from the leaf epidermis of 40-day-old plants grown under short day conditions with the indicated genotypes. Double transgenics expressing UBQ::mCherry-ATG8a (T2 generation) in the atmc1 AtMC1C220A-GFP background were treated with either DMSO as control (upper panels) or 1 μM Concanamycin A (Conc A) to be able to visualize fluorescently labelled proteins inside the vacuole (bottom panels). Arrows in the merged image (GFP and RFP channel) indicate colocalization of ATG8a-labelled autophagosomes along with AtMC1C220A puncta structures. Scale bar = 10 μm. (B) Representative images of 40-day-old plants with the indicated genotypes grown under short day conditions. Scale bar = 5.5 cm. (C) Representative confocal microscopy images from the leaf epidermis of 40-day-old plants grown under short day conditions with the indicated genotypes. Images represent a Z-stack of 18 images taken every 1 μm. Arrows indicate some of the puncta structures formed when AtMC1C220A is overexpressed in an atmc1 mutant background. Scale bar = 10 μm. Source data are available online for this figure.
Figure 9
Figure 9. Overexpression of the E3 ubiquitin ligase SNIPER1 rescues the autoimmune phenotype caused by catalytically inactive AtMC1.
(A) Representative images of 40-day-old plants with the indicated phenotypes grown under short day conditions. Two independent stable transgenics in the T2 generation expressing HA-SNIPER1 (#1 and #2) under the control of a 35S constitutive promoter in the atmc1 AtMC1C220A-GFP background are shown. Scale bar = 5.5 cm. (B) Trypan blue staining of an area belonging to the 6th true leaf of the plants shown in (A). Scale bar = 1.25 mm. (C) Total protein extracts from the plants shown in (A) were run on an SDS-PAGE gel and immuno-blotted against the indicated antisera. Comassie Blue staining (CBS) of the immunoblotted membranes shows protein levels of Rubisco as a loading control. (D) Representative confocal microscopy images from the leaf epidermis of 40-day-old plants grown under short day conditions with the indicated genotypes. Images represent a Z-stack of 10 images taken every 1 µm. Scale bar = 20 µm. (E) Quantification of the number of puncta from six different plants of the indicated genotypes. The same number of cells were counted for each genotype and the puncta was counted using the SiCE spot detector Macro for ImageJ (n = 6). P-value was calculated using a two-tailed unpaired Student’s t test. In box plot, the centre line indicates the median, the bounds of the box show the 25th and 75th percentiles, the whiskers indicate minimum to maximum values. Source data are available online for this figure.
Figure 10
Figure 10. Model of the role of AtMC1 in plant autoimmunity.
In adult Wt plants (left, upper panel), active AtMC1 contributes to the maintenance of steady-state levels of NLRs likely by promoting the formation of transient condensates that are degraded by autophagy. In addition, NLRs are also degraded by the proteasome. In atmc1 mutants (left, bottom panel), MC1-immuno condensates are no longer formed and NLRs are mostly degraded via the proteasome. The amount of NLRs present in the cell slightly increases and produces a mild autoimmune phenotype. Overexpression of inactive AtMC1C220A in atmc1 mutant background (right, upper panel), produces the stabilization of aberrant MC1-immuno condensates that can only partially be removed by autophagy, thus producing and accumulation of NLRs and a strong autoimmune phenotype. When, autophagosome formation is in addition depleted in these plants (right, middle panel), high amounts of aberrant condensates containing NLRs are accumulated which produces a very strong autoimmune response. By contrast, when exacerbating the degradation of NLRs via proteasome by overexpression of the E3 ligase SNIPER1 (right, bottom panel), no autoimmune response is observed. In this situation, some aberrant condensates might still be formed but can be successfully degraded by autophagy.
Figure EV1
Figure EV1. Absence of AtMC1 results in mild autoimmunity.
(A) Schematic representation of atmc1 CRISPR mutants, depicting the locations of the two guide RNAs (gRNAs) targeting the AtMC1 gene. The location of the T-DNA insertion of the T-DNA atmc1 mutant is indicated with an orange triangle. Below, Sanger sequencing chromatograms showing the site of deletion of atmc1-CR#1 and atmc1-CR#2. (B) Representative image of 40-day-old Wt, atmc1 and atmc1-CR#1 plants grown under short day conditions. Scale bar = 5.5 cm. (C) Trypan blue staining of an area belonging to the 6th true leaf of the plants shown in (A). Scale bar = 0.5 mm. (D) Plant fresh weight of genotypes shown in (A) (n = 12). Different letters indicate statistical difference in fresh weight between genotypes (one-way ANOVA followed by post hoc Tukey, p value < 0.05). In box plot, the centre line indicates the median, the bounds of the box show the 25th and 75th percentiles, the whiskers indicate minimum to maximum values. (E) Total protein extracts from the plant genotypes shown in (A) were run on an SDS-PAGE gel and immuno-blotted against anti-PR1a. Coomassie Blue Staining (CBS) of the immunoblotted membranes shows protein levels of Rubisco as a loading control. (F) Bacterial growth on the indicated genotypes 3 days post-infection with virulent Pseudomonas syringae DC3000 strain. Different letters indicate statistical difference (one-way ANOVA followed by post hoc Tukey, p value < 0.05) (n = 14). In box plot, the centre line indicates the median, the bounds of the box show the 25th and 75th percentiles, the whiskers indicate minimum to maximum values. (G) Bacterial growth on the indicated genotypes 3 days post-infection with avirulent Pseudomonas syringae AvrRpt2 strain (n = 11 biological replicates). P-value was calculated using a two-tailed unpaired Student’s t test. In box plot, the centre line indicates the median, the bounds of the box show the 25th and 75th percentiles, the whiskers indicate minimum to maximum values.
Figure EV2
Figure EV2. Constitutive immune activation in atmc1 plants is dependent on SA synthesis and immune signalling through EDS1-PAD4.
(A) Representative image of 40-day-old Wt, atmc1, atmc1 eds1-12, atmc1 sid2-1, atmc1 pad4-1 and atmc1 nrg1.1 nrg1.2 grown under short day conditions. Scale bar = 5.5 cm. (B) Trypan blue staining of an area belonging to the 6th true leaf of the plants shown in (A). Scale bar = 0.5 mm. (C) Plant fresh weight of genotypes shown in (A) (n = 15). Different letters indicate statistical difference in fresh weight between genotypes (one-way ANOVA followed by post hoc Tukey, p value < 0.05). In box plot, the centre line indicates the median, the bounds of the box show the 25th and 75th percentiles, the whiskers indicate minimum to maximum values. (D) Total protein extracts from the plant genotypes shown in (A) were run on an SDS-PAGE gel and immuno-blotted against anti-PR1a. Comassie Blue Staining (CBS) of the immunoblotted membranes shows protein levels of Rubisco as loading control.
Figure EV3
Figure EV3. Overexpression of a catalytically inactive AtMC2 in an atmc2 mutant background does not cause autoimme phenotype.
(A) Representative images of 40-day-old plants with the indicated genotypes grown under short day conditions. Two independent stable transgenic plants of the T2 generation expressing either AtMC2-GFP (#9 and #10) or AtMC2C256A-GFP (#3 and #7) under the control of a 35S constitutive promoter in the atmc2 mutant background are shown. Scale bar = 5.5 cm. (B) Total protein extracts from the plant genotypes shown in (A) were run on an SDS-PAGE gel and immuno-blotted against with the indicated antisera. Comassie Blue Staining (CBS) of the immunoblotted membranes shows protein levels of Rubisco as a loading control. (C) Representative images of 40-day-old plants with the indicated genotypes grown under short day conditions. Three independent stable transgenic lines expressing AtMC1C220A-GFP under the control of a 35S constitutive promoter in the atmc1 atmc2 mutant backgrounds are shown. Scale bar = 5.5 cm.
Figure EV4
Figure EV4. Autoimmunity caused by catalytically inactive AtMC1 is partially dependent on the hNLR family ADR1 but not NRG1.
(A, B) Representative images of 40-day-old plants with the indicated genotypes grown under short day conditions. Scale bar = 5.5 cm. (C, D) Total protein extracts from the plant genotypes shown in (A, B) were run on an SDS-PAGE gel and immuno-blotted against the indicated antisera. Comassie Blue Staining (CBS) of the immunoblotted membranes shows protein levels of Rubisco as a loading control. (E) Plant fresh weight of the indicated genotypes (n = 12). Different letters indicate statistical difference in fresh weight between genotypes (one-way ANOVA followed by post hoc Tukey, p value < 0.05). In box plot, the centre line indicates the median, the bounds of the box show the 25th and 75th percentiles, the whiskers indicate minimum to maximum values. Quantification of fresh weight from Wt, helperless, helperless/ AtMC1C220A-GFP and nrg1.1 nrg1.2 were excluded from the fresh weight graph to better appreciate statistical differences between genotypes of interest. (F) Trypan blue staining of an area belonging to the 6th true leaf of the plants shown in (B). Scale bar = 0.5 mm.
Figure EV5
Figure EV5. Catalytically inactive AtMC1 interacts in planta with NLRs, and immune components involved in PTI.
(AE) AtMC1-GFP, AtMC1C220A-GFP or free GFP were transiently co-expressed with either RPS2-HA (A), SSI4-3xHA (B), FLAG-RBOHF (C), 10xcMyc-RLP42 (D) or 10xcMyc SOBIR1 (E) in N. benthamiana. 3 days post-infiltration (dpi) plant extracts co-expressing the indicated constructs were immunoprecipitated with anti-GFP magnetic beads (IP GFP). Protein inputs from protein extracts before IP (INPUTS) and eluates from IPs were run on an SDS-PAGE and immunoblotted against the indicated antisera. Coomassie Blue Staining (CBS) of the immunoblotted membranes shows protein levels of Rubisco as a loading control in the inputs.

References

    1. Asqui Lema S, Vercammen D, Serrano I, Valls M, Rivas S, Van Breusegem F, Conlon FL, Dangl JL, Coll NS (2018) AtSERPIN1 is an inhibitor of the metacaspase AtMC1‐mediated cell death and autocatalytic processing in planta. New Phytol 218:1156–1166 - PubMed
    1. Balint‐Kurti P (2019) The plant hypersensitive response: concepts, control and consequences. Mol Plant Pathol 20:1163–1178 - PMC - PubMed
    1. Bayle V, Platre M, Jaillais Y (2017) Automatic quantification of the number of intracellular compartments in arabidopsis thaliana root cells. BIO-PROTOCOL 7:e2145 - PMC - PubMed
    1. Bi G, Su M, Li N, Liang Y, Dang S, Xu J, Hu M, Wang J, Zou M, Deng Y et al (2021) The ZAR1 resistosome is a calcium-permeable channel triggering plant immune signaling. Cell 184:3528–3541.e12 - PubMed
    1. Bomblies K, Weigel D (2007) Hybrid necrosis: autoimmunity as a potential gene-flow barrier in plant species. Nat Rev Genet 8:382–393 - PubMed

MeSH terms

LinkOut - more resources