. 2025 Mar 20;5(1):79.
doi: 10.1038/s43856-025-00786-x.

Acquired resistance to immune checkpoint therapy is caused by glycoprotein non-metastatic melanoma protein B signal cascade

Affiliations

Acquired resistance to immune checkpoint therapy is caused by glycoprotein non-metastatic melanoma protein B signal cascade

Jin-Sung Chung et al. Commun Med (Lond). .

Abstract

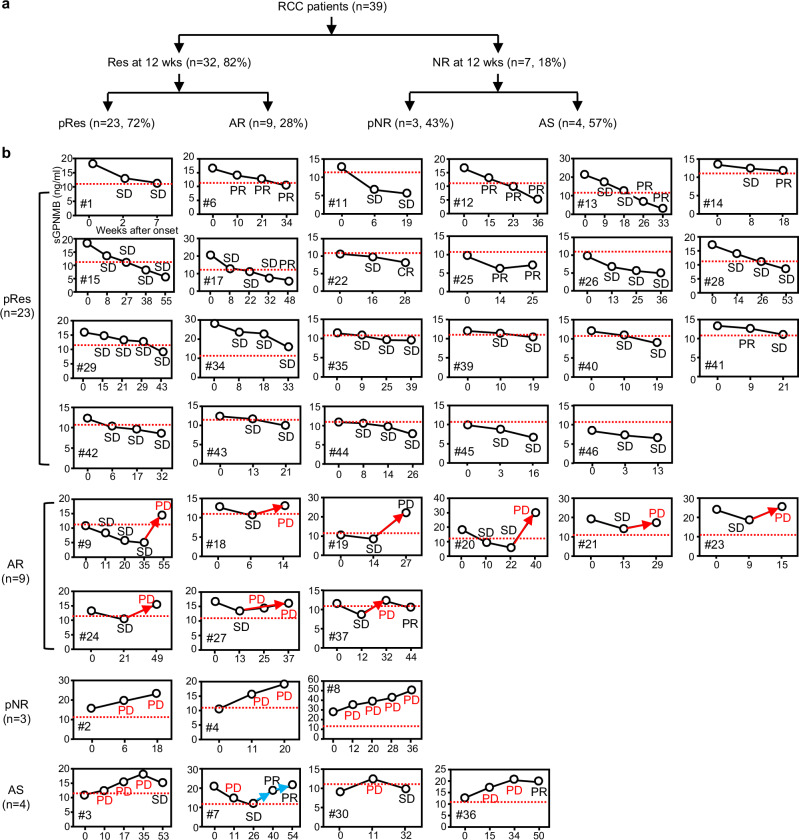
Background: Acquired resistance (AR) is a major limitation of immune checkpoint inhibitor (ICI) therapy when treating renal cell carcinoma (RCC). Understanding who will get AR is currently unknown. We hypothesized the T-cell-inhibitory glycoprotein non-metastatic melanoma protein B (GPNMB) to be a prognostic marker for patients with AR.

Methods: Alongside other markers, GPNMB was measured in the blood of RCC patients (n = 39) several times after starting ICI treatment and analyzed for association with Response Evaluation Criteria in Solid Tumors (RECIST) tumor response. To better understand the role of GPNMB in AR, we created an ICI-resistant RenCa mouse kidney cancer model by repeatedly selecting the largest tumors that grew in ICI-treated mice.

Results: Here we show that among patients who positively respond to ICI, a subset of patients (n = 9) acquire resistance within 2 years that coincides with an increase in serum GPNMB. Our mouse model recapitulates this elevation in GPNMB at the onset of AR which is triggered by cytoplasmic motif signaling via the Programmed cell death ligand 1 (PDL1) receptor that is known to protect tumors from Interferon-gamma (IFN-γ) cytotoxicity. This PDL1-induced signal leads to upregulation of the SRY-box transcription factor 10 (SOX10), dysregulation of the microphthalmia-associated transcription factor (MITF) pathway, and overexpression of GPNMB. Indeed, activation of SOX10-MITF signaling is present in plasma cell-free RNA from RCC patients who develop AR.

Conclusions: Elevation of the SOX10-MITF-GPNMB signal cascade via the PDL1 receptor leads to AR. Therefore, GPNMB can be both a prognosticator of and a potential treatment target for overcoming AR to ICI treatment in RCC.

Plain language summary

Immune checkpoint inhibitors (ICI) are a type of cancer treatment that helps the immune system kill cancer cells. However, over half of people with kidney cancer who initially see a benefit following ICI treatment find the drug stops working for them, with their cancer acquiring resistance to this treatment. In this study, we investigated if a protein known as glycoprotein non-metastatic melanoma protein B (GPNMB) increases in cancers that do not respond to ICI therapy. We find that elevated GPNMB levels coincide with the onset of treatment resistance to ICI therapy in both humans and a mouse model of kidney cancer. Therefore, measuring GPNMB levels during ICI therapy can inform if a patient will become resistant to treatment. Additionally, GPNMB may serve as a potential target for overcoming such resistance.


Conflict of interest statement

Competing interests: The authors declare no competing interests.

Figures

Fig. 1
Fig. 1. High blood sGPNMB levels correlate significantly with tumor progression at 12 weeks post-ICI treatment.
RCC patients (n = 42) were evaluated for tumor response at 12 weeks post-therapy and determined for sGPNMB levels and myeloid-derived suppressor cells (MDSC) frequencies in blood samples drawn at the same time point. Patients were sorted into responders (stable disease (SD)/partial response (PR)) and non-responders (progressive disease (PD)). % total population or GPNMB+ subpopulation of monocytic (M)-MDSC (a) or granular (G)-MDSC (b) in responders vs. non-responders. Blood levels of sGPNMB (c), sPDL1 (d), and sVEGF (e) between responders vs. non-responders. f Correlation between tumor size and blood sGPNMB levels at 12 weeks. p values are shown, and analyzed by Pearson Correlation Coefficient or Mann–Whitney U test.
Fig. 2
Fig. 2. Blood sGPNMB level parallels the course of tumor response to ICI treatment.
a RCC patients (n = 39) were categorized into responders (Res) and non-responders (NR) based on 12-week evaluations after starting ICI. While most Res maintained a positive response (persistent Res or pRes), some Res acquired resistance (AR) to ICI. NR were sorted into those who never responded positively (pNR) and those who displayed a delayed positive response (acquired sensitivity or AS). Patient number in each category and frequency among total RCC cases are indicated. b Chronological changes (weeks after onset) in sGPNMB in each individual patient are shown, with red-dashed lines indicating the median sGPNMB value (11.3 ng/ml) of the stable disease (SD)/partial response (PR) group. Red and blue lines indicate a rise in transition to progressive disease (PD) and to PR, respectively. Note: pRes who displayed PR did not take many treatment cycles so that blood samples were not available at >36 weeks.
Fig. 3
Fig. 3. ICI-resistant RenCa tumors express upregulated Gpnmb expression and immunosuppressive phenotypes.
a Generation of ICI-resistant RenCa cells. RenCa P0 (parental cells) were implanted subcutaneously into BALB/c mice (n = 4) and treated with anti-PD1 or control Ab (shown by blue reverse arrows). After five shots, the largest tumors (shown by red lines) were excised, cultured in vitro, and implanted into new mice and similarly treated (termed P0 to P4). This enrichment was repeated four times. Tumor volume is shown. b P0 to P4 cells were assayed by qRT-PCR for RNA expression of Gpnmb and PDL1 to Gapdh (mean ± SEM, n = 3). c Dot plots of flow-cytometric analysis of P0 and P4 cells fluorescently stained for expression of Gpnmb or PDL1, with mean fluorescence intensity (MFI). d Kinetics of sGpnmb secretion by in vitro cultured P0 and P4 cells. e Growth curves of P0 and P4 subcutaneous tumors in mice (n = 4) treated with anti-PD1 Ab (by closed arrows on the top). Blue arrows show the date of blood drawn. f Blood sGpnmb levels in mice treated with Ab (e) are plotted at varying time points post-implantation of P0 or P4 cells. −3 means 3 days prior to tumor implantation. Untreated P0 and P4 tumors (~1 cm size) are IHC-stained with control IgG (Ctrl), or Ab to CD4, CD8, CD11b, CD31, or tryptase (scale bar, 100 μm, g) and assayed for tumor density of each cell population (h) (mean ± SEM, n = 5); (Ab-stained area μm2/mm2 microscopic view), average of nine different views ± SD, from five different tumors. Bone marrows of the same mice were analyzed by qRT-PCR for Gpnmb or PDL1 RNA (i) (mean ± SEM, n = 3). and by flow cytometry for frequencies of different leukocyte populations (j) (mean ± SEM, n = 4). Representative of three separate experiments except (ac). p values are shown, using Student’s t-test comparing two conditions.
Fig. 4
Fig. 4. Upregulated sGpnmb expression is responsible for ICI resistance in RenCa tumor model.
ad P0 (a) or P4 cells (b, c) were implanted subcutaneously (s.c.) into mice (n = 5) and treated with control, anti-Gpnmb (αGpnmb) or anti-PD1 (αPD1) mAb. Tumor volume is measured. Blue arrows show the date of blood drawn. P4 tumor weights in each treatment group were measured at the endpoint (c) (mean ± SEM, n = 5). d Blood samples collected from mice (b) were determined for sGPNMB and plotted against days after implantation. e Survival rate (%) of P4 tumor-bearing mice (n = 10) treated with control, anti-PD1 or anti-Gpnmb Ab, until day 60; p value compared to PD1 treatment group. f, g Total cells were prepared from Ab-treated tumors and sorted into CD45+ fraction in flow cytometry, followed by determination of % leukocyte subtype among CD45+ cells. Representative dot plots are shown, with % positivity (f). Data are summarized in a graph (g) (mean ± SEM, n = 5). hj RenCa parental cells transfected with Tet-Off-controlled sGpnmb gene were implanted subcutaneously (s.c.) into mice treated with doxycycline (Dox). On day 6, all mice were sorted into two groups. Dox-continued and Dox-discontinued (PBS-injected) and treated with anti-PD1 or control (Ctrl) Ab (h). Tumor volume is measured (i). On day 24, tumors were excised and measured (j) (mean ± SEM, n = 5). Data shown are representative of at least two independent experiments. P values are compared to control group using two-way ANOVA.
Fig. 5
Fig. 5. Transcriptome analysis of P0 vs. P4 tumors treated with anti-PD1 Ab.
a A total of 18,301 genes were analyzed between control- vs. PD1 Ab-treated tumors and expressed as Volcano Plots shown with statistical significance (Log10P from 2 or 3 data batches, y-axis) vs. Log2FC x-axis. Each dot (gene expression) shows values in PD1 Ab samples relative to control Ab. Blue, gray, and red dots show up-, non-significant, and down-regulation, respectively. b Heatmap analyses of top 40 differentially expressed genes (DEGs) in P0 or P4 tumors treated with PD1 vs. control Ab are shown.
Fig. 6
Fig. 6. P4 cells exhibit dysregulated Mitf genes and upregulated Gpnmb promoter.
qRT-PCR analysis of Mit family (Mitf, Tfe3, Tfeb, and Tfec) (a) and Sox10 (b) in P0 vs. P4 cells (mean ± SEM, n = 3). c Proportion of Mitf isoform transcripts in P0 vs. P4 cells is calculated and expressed in Pie chart. d RT-PCR analysis of Mitf isoforms in varying cell lines (P0, P4, B16 melanoma, and Raw macrophages), run on 1.5% agarose gel/ethidium bromide. The bp size of PCR products is shown at the right of the figure. e P0 or P4 cells were transfected with increasing doses of pGL3b (basic promoter-Luc), pG-Gpnmb-p (Gpnmb promoter-linked pGL3b), pG-Gpnmb-p-ΔA (MITF-A site-deleted Gpnmb promoter), pG-Gpnmb-p-ΔΒ (MITF-B-deleted), or pG-Gpnmb-p-ΔAB (both A and B sites-deleted). Luciferase (Luc) activities were measured and expressed as Luc/Renilla × 100 (n = 3, average ± SD). Representative of three experiments. f Heatmap analyses of expression of 43 Mitf-target genes in P0 vs. P4 cells (three different batches per sample) are shown using RNA-seq data (Supplementary Data 2 and 3). p values in (a, b) are shown using Student’s t-test. Adjusted p value is indicated in parenthesis, using the Benjamini–Hochberg procedure.
Fig. 7
Fig. 7. PDL1 signaling activates Sox10-regulated Mitf-Gpnmb axis.
a Sox10- or Mitf-targeted or control shRNA was transfected into P4 cells and determined by qRT-PCR for expression of indicated genes. Mitf gene expression is shown as transcripts of Mitf common regions. Expression is shown as % of control gene expression in control shRNA-transfected cells (mean ± SEM, n = 3). b RenCa or Caki-2 cells were cultured for 0 (immediately harvested), 1, and 2 days with immobilized anti-PDL1 Ab and quantified for SOX10 gene expression (mean ± SEM, n = 3). c Deletion mutant analysis of PDL1 signaling. The cytoplasmic amino acid sequences of all mutants with deletion or amino acid substitution are schematically presented. The entire cytoplasmic region is shown at the top. The deleted region is shown by gray-filled bars, with amino acid residues of the junction between both ends. Lysine-to-arginine substitution at 171 aa (R171) or 280 aa (R280) is also constructed. These genes were separately transfected into 293T cells and assayed for upregulated SOX10 gene expression by PDL1-crosslinking and expressed as % of WT-induced full rise (mean ± SEM, n = 3). Data are representative of at least two experiments. p values are shown, compared to control using Student’s t-test.
Fig. 8
Fig. 8. Increased SOX10-MITF cfRNA in RCC patients after transition to acquired resistance.
a Schematic presentation of nested real-time PCR analysis. b Nested qPCR standard curves: target cDNA template (23 μM) was 10-fold serially diluted, PCR-amplified for 15 cycles, and an aliquot (5% of total products) was then subjected to nested qPCR. Dilution factors are plotted against Cq value. c Plasma cfRNA at varying time points of acquired resistance patients (Pat #9, 19, and 20, Fig. 2b) and from three healthy donors (HD #1, 2, and 3) were quantified by nested qPCR for expression of GPNMB, MITF, SOX10, and β-ACTIN relative to GAPDH, and expressed as fold change to Week 0 of each patient (average, n = 2). Expression levels in HD are indicated by relative expression to the value at week 0 of Pat #9. Gray-filled bars represent time points for stable disease (SD) just before progressive disease PD (shown in black-filled bars). p values are shown, using Student’s t-test comparing gray- and black-filled bars in patients or #1 and #3 β-ACTIN in HD.

References

    1. Hammers, H. Immunotherapy in kidney cancer: the past, present, and future. Curr. Opin. Urol.26, 543–547 (2016). - PubMed
    1. Hammers, H. J. et al. Safety and efficacy of nivolumab in combination with ipilimumab in metastatic renal cell carcinoma: the CheckMate 016 study. J. Clin. Oncol.35, 3851–3858 (2017). - PMC - PubMed
    1. Motzer, R. J. et al. Nivolumab for metastatic renal cell carcinoma: results of a randomized phase II trial. J. Clin. Oncol.33, 1430–1437 (2015). - PMC - PubMed
    1. Moreira, M. et al. Resistance to cancer immunotherapy in metastatic renal cell carcinoma. Cancer Drug Resist.3, 454–471 (2020). - PMC - PubMed
    1. Jenkins, R. W., Barbie, D. A. & Flaherty, K. T. Mechanisms of resistance to immune checkpoint inhibitors. Br. J. Cancer118, 9–16 (2018). - PMC - PubMed

LinkOut - more resources