. 2025 Mar 20;23(1):146.
doi: 10.1186/s12964-025-02140-z.

Induction of LY6E regulates interleukin-1β production, potentially contributing to the immunopathogenesis of systemic lupus erythematosus

Affiliations

Induction of LY6E regulates interleukin-1β production, potentially contributing to the immunopathogenesis of systemic lupus erythematosus

Jenn-Haung Lai et al. Cell Commun Signal. .

Abstract

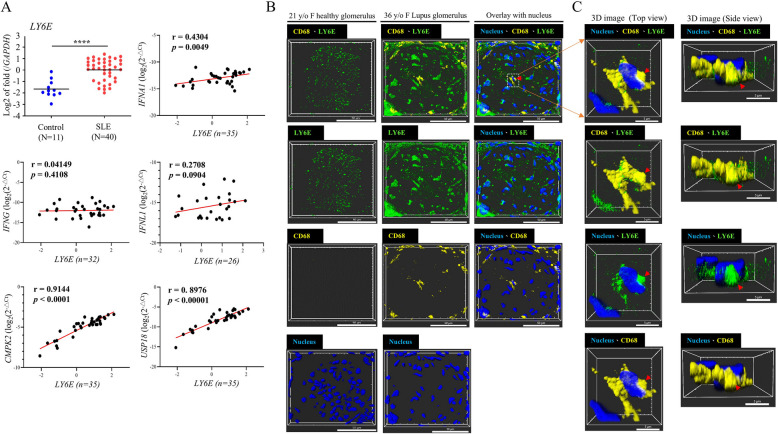
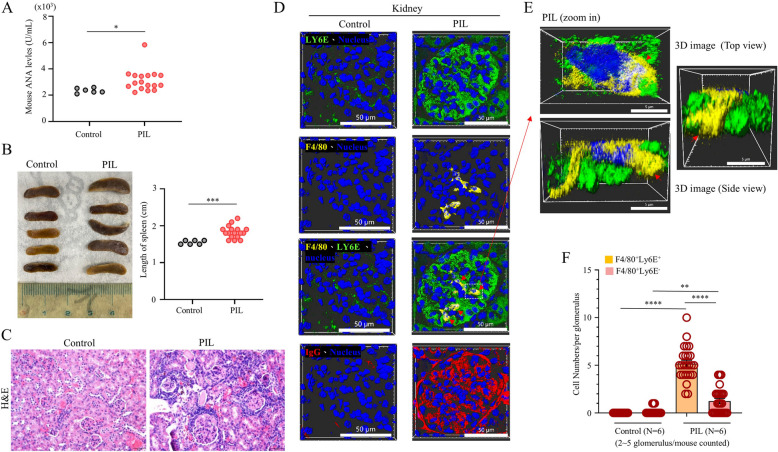
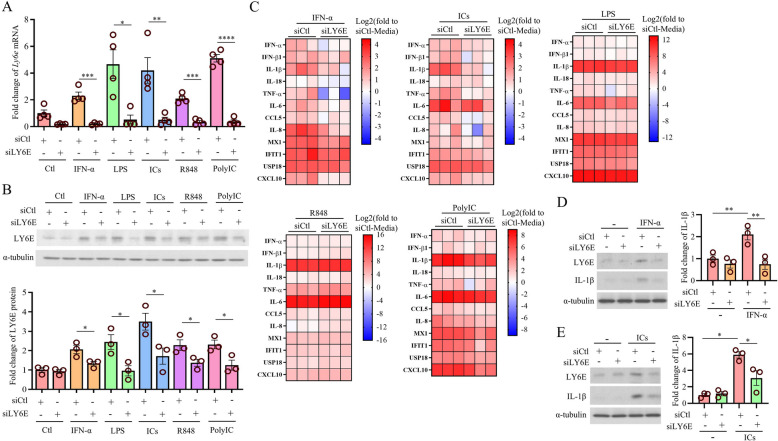
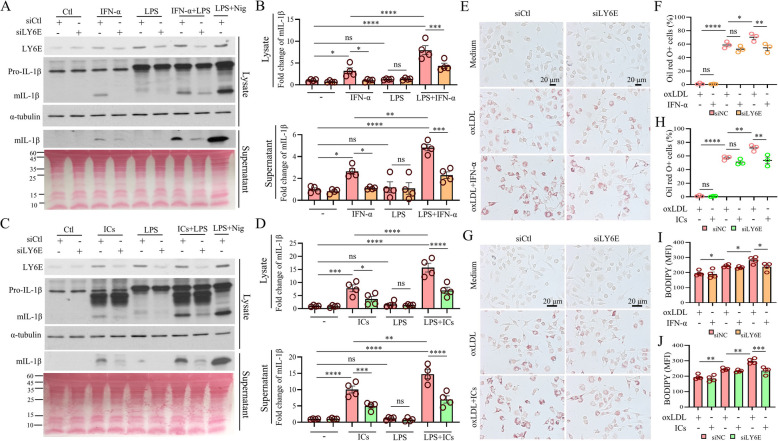
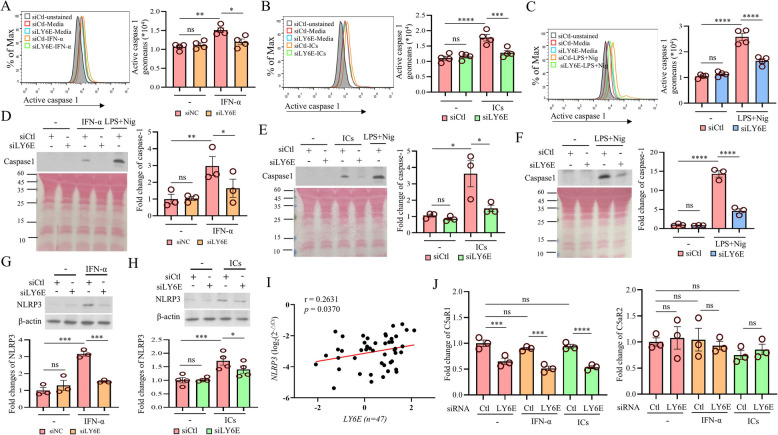
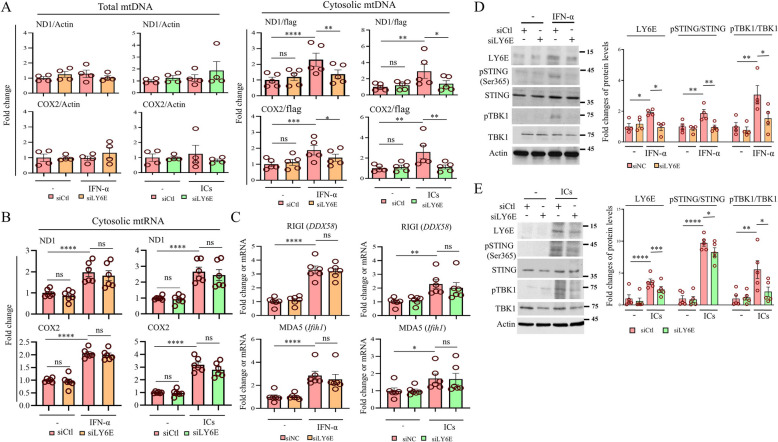
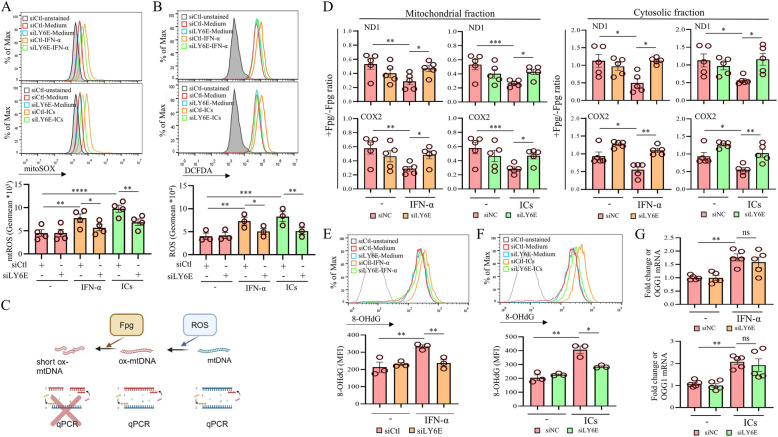
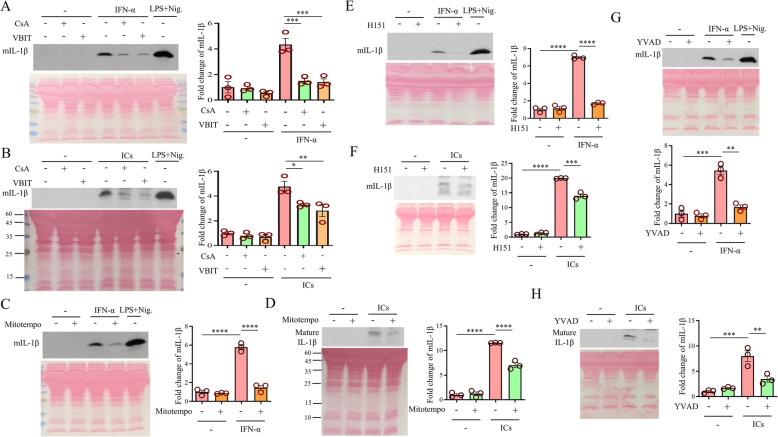
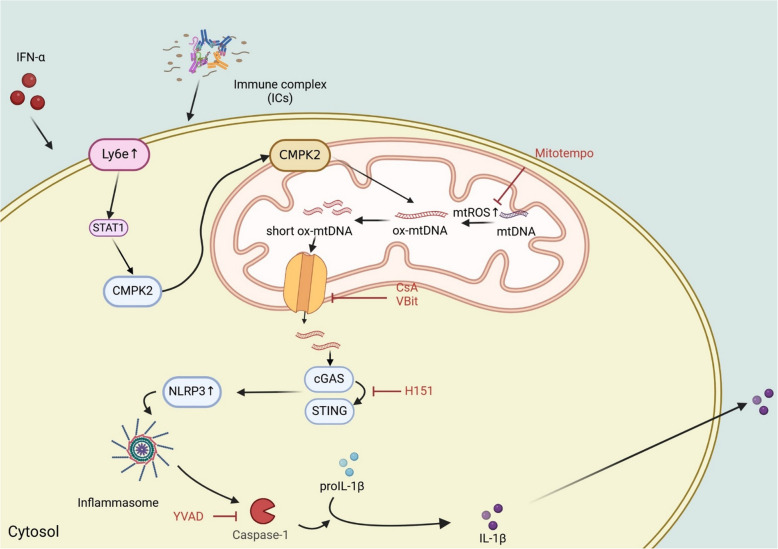
Systemic lupus erythematosus (SLE) is an autoimmune disorder characterized by the deposition of immune complexes (ICs) in various organs, especially the kidney, leading to lupus nephritis, one of the major and therapeutically challenging manifestations of SLE. Among the various cytokines induced in SLE, type I interferons (IFN-Is) play crucial roles in mediating immunopathogenesis, and anti-IFN-I treatment has been approved for SLE treatment. The uptake of ICs by macrophages results in macrophage activation, which initiates, triggers, and exaggerates immune responses in SLE. After observing the induction of an IFN-stimulated gene, LY6E, in monocytes from SLE patients, we demonstrated the colocalization of both LY6E and a macrophage marker in kidneys from pristane-induced lupus-prone mice and from patients with lupus nephritis. By studying mouse bone marrow-derived macrophages, we showed that LY6E regulated IFN-α- and IC-induced production and secretion of mature interleukin-1β (mIL-1β), foam cell formation and several mitochondria-associated mechanisms, such as the release of mitochondrial DNA (mtDNA) but not mitochondrial RNA (mtRNA) into the cytosol, the generation of mitochondrial reactive oxygen species (mtROS) and ROS, the activation of caspase 1, NLRP3, and the stimulator of interferon genes (STING) signaling pathway, and the activation of cytidine/uridine monophosphate kinase 2 (CMPK2), which were involved in LY6E-mediated immunomodulatory effects. In addition, synergistic effects of a combination of IL-1β and IFN-α and of IL-1β and ICs on the induction of the expression of IFN-stimulated genes were observed. In addition to revealing the proinflammatory roles and mechanisms of LY6E in macrophages, given that various subgroups of macrophages have been identified in the kidneys of patients with lupus nephritis, targeted treatment aimed at LY6E may be a potential therapeutic for lupus nephritis.

Keywords: Interferon-alpha; Interleukin-1; LY6E; Lupus nephritis; Macrophages; Systemic lupus erythematosus.


Conflict of interest statement

Declarations. Ethics approval and consent to participate: The use of human blood samples was approved by the IRB (no. 201509825A3) of Chang Gung Memorial Hospital, Linko, Taiwan. This study was performed in accordance with the Declaration of Helsinki. Competing interests: The authors declare no competing interests.

Figures

Fig. 1
Fig. 1
Induction of LY6E in peripheral blood monocytes and kidney macrophages from SLE patients. CD14 + monocytes were prepared from the peripheral blood of 40 SLE patients and 11 healthy controls. The expression of LY6E, IFNA1, IFNG, IFNL1, CMPK2 and USP18 mRNAs was determined by qPCR and analyzed via the Mann‒Whitney U test and Pearson correlation coefficient. Each data point represents a log2 (2−△.Ct) value for LY6E in an individual patient (A). The correlations between LY6E mRNA and IFNA1, IFNG, IFNL1, CMPK2 and USP18 mRNAs in CD14 + monocytes prepared from patients with SLE were analyzed (A). Kidney samples from a 21-year-old healthy female and a 36-year-old female patient with lupus nephritis were examined by immunohistochemical staining and analyzed by confocal microscopy, and 3-dimensional (B) and 3-dimensional zoomed-in images (C) are shown. ****P < 0.0001
Fig. 2
Fig. 2
There was a greater population of infiltrating macrophages in kidneys that expressed LY6E compared to those not expressing LY6E in pristane-induced lupus mice. Various numbers of pristane-induced lupus-prone mice were generated as described, maintained for 7 months and then sacrificed for the indicated studies. Several parameters related to inflammation were subsequently analyzed. The titers of serum ANA (A), sizes of the spleens (B), and H&E stains of the kidneys (C) were assessed in different tissue samples from PIL mice and control mice. The results of the immunohistochemical staining analysis of kidneys stained with Abs against LY6E (green), the mouse macrophage marker F4/80 (yellow), and IgG (red) and analyzed by confocal microscopy are presented in 3-dimensional (D) and 3-dimensional zoomed-in (E) images. The number of macrophages that expressed LY6E (LY6E +) or not (LY6E-) was calculated from 2–5 glomeruli of individual mice (F). Statistical analysis was performed with an unpaired t test and two-way ANOVA with Holm‒Sidak’s multiple comparisons test to compare differences among different treatments. *P < 0.05, **P < 0.01, ****i < 0.0001. PIL, pristane-induced lupus
Fig. 3
Fig. 3
LY6E deficiency inhibited IL-1β expression induced by stimulation with IFN-α and ICs. BMDMs (2 × 10.6) were electroporated with 300 nM LY6E siRNA (siLY6E) or control siRNA (siCtl) and then stimulated with or without various stimuli as indicated for 24 h. The concentrations of the individual stimuli used were as follows: the TLR7/8 agonist R848 (2.5 μg/ml), the TLR3 agonist PolyIC (10 μg/ml), LPS (100 ng/ml), IFN-α (100 U/ml), and ICs (10 μg/ml). The mRNA and protein levels of LY6E were determined by qPCR (A) and Western blotting (B), respectively. The mRNA expression of several inflammation-associated molecules induced by various stimuli with or without LY6E deficiency conditions was determined (C). The IFN-α- and IC-induced expression of IL-1β with or without LY6E knockdown was determined by Western blotting (D and E). Each data point represents one mouse, and the values are fold changes relative to the mean of the siCtl in RT‒qPCR and Western blotting. For Western blotting, the samples were derived from the same experiment, and both the gels and the blots were processed in parallel. Statistical analysis was performed with Student’s t test to compare the means between two groups (A and B) or two-way ANOVA with Holm‒Sidak’s multiple comparisons test to compare differences among different treatments (D and E). *P < 0.05, **P < 0.01, ****P < 0.0001
Fig. 4
Fig. 4
LY6E deficiency inhibited mIL-1β production and foam cell formation induced by IFN-α and ICs. BMDMs (2 × 10.6) were electroporated with 300 nM LY6E siRNA (siLY6E) or control siRNA (siCtl) and then stimulated with or without IFN-α (100 U/ml), 10 μg/ml ICs, 100 ng/ml LPS, or a combination of these stimuli for 24 h. For inflammasome activation control, cells were stimulated with LPS (500 ng/mL) for 4 h, followed by treatment with nigericin (5 μM) for 1 h (LPS + Nig). The total cell lysates and supernatants were separately collected for the measurement of several proteins as indicated by Western blotting (A and C). The loading control for supernatants is shown with Ponceau S stain. Each data point represents one mouse, and values are fold changes relative to the mean of the siCtl group. The statistical results from several independent experiments are shown (B and D). BMDMs were stimulated with oxLDL in the presence or absence of IFN-α or ICs, and foam cell formation was measured by Oil Red O staining. The cells were examined via light microscopy, and the percentages of Oil Red O-positive cells in 5 microscopic fields for each independent experiment were determined and statistically analyzed (E, F, G and H). Moreover, BODIPY dye analysis was carried out according to the description in the Materials and Methods (I and J). Each data point represents one mouse, and the values are fold changes relative to the mean of the siCtl treatment, as determined by Western blotting. Statistical analysis was performed with two-way ANOVA with Holm‒Sidak multiple comparisons to compare differences among different treatments. *P < 0.05, **P < 0.01, ***P < 0.001, ****P < 0.0001
Fig. 5
Fig. 5
LY6E knockdown inhibited the IFN-α- and IC-induced expression of active caspase 1. BMDMs (2 × 10.6) were electroporated with 300 nM siLY6E or siCtl and then stimulated with or without IFN-α or ICs for 24 h. As a positive control, LPS (500 ng/mL) was used to stimulate the cells for 4 h, followed by treatment with nigericin (5 μM) for 1 h (LPS + Nig). The expression of active caspase 1 was determined by flow cytometry in lysates (A, B, and C) or by Western blotting in supernatants (D, E, and F). NLRP3 expression was measured by Western blotting (G and H). The correlation between LY6E and NLRP3 mRNA levels in monocytes from SLE patients was determined (I). In parallel, the expression of complement 5a receptor 1 (C5ar1) and C5ar2 mRNAs was determined by qPCR (J). Each data point represents one mouse, and the values are fold changes relative to the mean value of the siCtl in RT‒qPCR and Western blotting. The values for the flow cytometry results are presented as the geomeans (MFIs). Two-way ANOVA with Holm‒Sidak multiple comparisons was used to compare differences among different treatments. *P < 0.05, **P < 0.01, ***P < 0.001, ****P < 0.0001
Fig. 6
Fig. 6
LY6E regulated the IFN-α- and IC-induced release of mtDNA into the cytosol. BMDMs were electroporated with siLY6E or siCtl and then stimulated with or without IFN-α or ICs for 24 h. Both total DNA and cytosolic DNA were extracted to measure mtDNA levels with specific primers via qPCR, as described in the Materials and Methods. The relative abundance of total and cytosolic mtDNA was determined by normalization to actin or an exogenously added plasmid encoding the FLAG gene (PCR3.1-flag) (A). The levels of cytosolic mtRNA were similarly measured (B). The expression of two mtRNA downstream signaling molecules, RIG-1 and MDA5, was determined by qPCR (C). Several mtDNA downstream signaling molecules, such as STING and TBK1, were examined for their activation status in IFN-α-stimulated (D) and IC-stimulated (E) BMDMs by Western blotting. For Western blotting, the samples were derived from the same experiment, and both the gels and the blots were processed in parallel. Each data point represents one mouse, and the values are fold changes relative to the mean value of the siCtl in RT‒qPCR and Western blotting. Two-way ANOVA with Holm‒Sidak multiple comparisons was used to compare differences among different treatments. *P < 0.05, **P < 0.01, ***P < 0.001, ****P < 0.0001
Fig. 7
Fig. 7
LY6E inhibited the production of mtROS, ROS, oxidized mtDNA and 8-OHdG but not OGG-1 induced by IFN-α and IC stimulation. BMDMs were electroporated with siLY6E or siCtl and then stimulated with or without IFN-α or ICs for 24 h. After adding 5 μM MitoSOX™ to the culture and incubating for 0.5 h, the intensity of MitoSOX fluorescence was measured and used as an indicator of mtROS levels (A). The generation of cellular ROS was measured by DCFDA staining followed by flow cytometry analysis (B). To determine the status of mtDNA oxidation, we used formamidopyrimidine DNA glycosylase (Fpg)-sensitive real-time PCR analysis. Treatment of mtDNA with Fpg removes oxidized purines from DNA and creates single-strand breaks, leading to blockade of PCR amplification at these sites. The different intensities of qPCR amplification between Fpg-treated and Fpg-untreated DNA reflect oxidative base damage and the percentage of intact DNA; recognition and cleavage by Fpg causes a decrease in the percentage and indicates an increase in the number of sequences harboring oxidized base products (C). Accordingly, the mtDNA oxidation status was measured in both the mitochondrial and cytosolic fractions of IFN-α- and IC-treated BMDMs with or without LY6E knockdown (D). The generation of 8-OHdG was determined by flow cytometry (E and F). The expression of Ogg1 mRNA was determined by qPCR (G). Each data point represents one mouse, and the values are fold changes relative to the mean value of the siCtl in RT‒qPCR and Western blotting. The values for the flow cytometry results are presented as the geomeans (MFIs). Statistical analysis was performed with two-way ANOVA with Holm‒Sidak multiple comparisons to compare differences among different treatments. *, P < 0.05; **, P < 0.01; ***, P < 0.001 and ****, P < 0.0001. MFI, mean fluorescence intensity
Fig. 8
Fig. 8
LY6E-knockdown effects were reproduced with the use of specific inhibitors of several different signaling pathways. BMDMs were treated with different inhibitors targeting LY6E-regulated and IFN-α- and IC-activated downstream signaling pathways, including 5 µM CsA or 10 µM VBIT-4 (A and B), 100 µM MitoTempo (C and D), 40 µM YVAD (G and H), or 2 μg/ml H151 (E and F), for 2 h, followed by stimulation with IFN-α or ICs for 24 h (A, B, C, D, G and H) or 6 h (E and F). After that, the supernatants were collected for the measurement of mIL-1β by Western blotting. The samples were derived from the same experiment, and both the gels and the blots were processed in parallel. The results of the statistical analysis of several independent experiments are presented. Statistical analysis was performed with two-way ANOVA with Holm‒Sidak multiple comparisons to compare differences among different treatments. CsA, cyclosporin A; VBIT-4, voltage-dependent anion channel oligomerization inhibitor. *, P < 0.05; **, P < 0.01; ***, P < 0.001 and ****, P < 0.0001
Fig. 9
Fig. 9
LY6E mediated its effects through regulating CMPK2. BMDMs were electroporated with siLY6E or siCtl and then stimulated with or without IFN-α, ICs, or LPS + nigericin (LPS + Nig) for 24 h, after which the Cmpk2 mRNA and protein levels were determined (A and B). BMDMs were electroporated with 300 nM siCMPK2 or siCtl and then stimulated with and without IFN-α or ICs for 24 h, and the levels of CMPK2 and LY6E in total cell lysates and both active caspase 1 (p20) and mIL-1β in supernatants were measured by Western blotting (C and D). BMDMs electroporated with siLY6E or siCtl were transduced with lentivirus carrying wild-type CMPK2-DYK or the control DYK vector. After 48 h, the medium was replaced with fresh medium, and the cells were then stimulated with IFN-α or ICs for 24 h. The measurement of mIL-1β in the supernatants (E and F) and mtDNA release into the cytosol (G and H) were carried out accordingly as previously described. Statistical analysis was performed with two-way ANOVA with Holm‒Sidak multiple comparisons to compare differences among different treatments. *, P < 0.05; **, P < 0.01; ***, P < 0.001 and ****, P < 0.0001
Fig. 10
Fig. 10
Synergistic effects of a combination of IL-1β and IFN-α or IL-1β and ICs in ISGs induction. BMDMs stimulated with IL-1β, IFN-α or ICs alone or in combination for 12 h or 24 h were collected, and the expression of several ISGs as indicated was determined by qPCR. Statistical analysis was performed with two-way ANOVA with Holm‒Sidak multiple comparisons to compare differences among different treatments. *, P < 0.05; **, P < 0.01; ***, P < 0.001 and ****, P < 0.0001
Fig. 11
Fig. 11
The proposed model summarizes how LY6E regulates IFN-α- and IC-induced mIL-1β production. Stimulation with either IFN-α or ICs induced LY6E expression. Induction with LY6E activated STAT1 and increased the transcription of CMPK2. The translocation of CMPK2 into mitochondria is, in part, responsible for several events occurring in mitochondria, such as the generation of mtROS and ROS, the increase in oxidized mtDNA and the release of mtDNA into the cytosol. Cytosolic mtDNA then activates the cGAS/STING and TBK1 pathways and the inflammasome pathway. These events lead to an increase in mIL-1β production and secretion. Several LY6E-mediated effects can be reproduced using specific inhibitors, as indicated

References

    1. Tsokos GC. The immunology of systemic lupus erythematosus. Nat Immunol. 2024;25:1332–43. - PubMed
    1. Rahman A, Isenberg DA. Systemic lupus erythematosus. N Engl J Med. 2008;358:929–39. - PubMed
    1. Chen PM, Tsokos GC. Mitochondria in the Pathogenesis of Systemic Lupus Erythematosus. Curr Rheumatol Rep. 2022;24:88–95. - PubMed
    1. Wang L, Xu H, Yang H, Zhou J, Zhao L, Zhang F. Glucose metabolism and glycosylation link the gut microbiota to autoimmune diseases. Front Immunol. 2022;13: 952398. - PMC - PubMed
    1. Caielli S, Wan Z, Pascual V. Systemic Lupus Erythematosus Pathogenesis: Interferon and Beyond. Annu Rev Immunol. 2023;41:533–60. - PubMed