. 2025 Mar 20;44(1):100.
doi: 10.1186/s13046-025-03355-1.

CircPVT1 weakens miR-33a-5p unleashing the c-MYC/GLS1 metabolic axis in breast cancer

Affiliations

CircPVT1 weakens miR-33a-5p unleashing the c-MYC/GLS1 metabolic axis in breast cancer

Alina Catalina Palcau et al. J Exp Clin Cancer Res. .

Abstract

Background: Altered metabolism is one of the cancer hallmarks. The role of circRNAs in cancer metabolism is poorly studied. Specifically, the impact of circPVT1, a well-known oncogenic circRNA on triple negative breast cancer metabolism is mechanistically underexplored.

Methods: The clinical significance of circPVT1 expression levels was assessed in human breast cancer samples using digital PCR and the cancer genome atlas (TCGA) dataset. The oncogenic activity of circPVT1 was assessed in TNBC cell lines and in MCF-10 A breast cell line by either ectopic expression or depletion of circPVT1 molecule. CircPVT1 mediated metabolic perturbation was assessed by 1 H-NMR spectroscopy metabolic profiling. The binding of circPVT1 to miR-33a-5p and c-Myc recruitment onto the Glutaminase gene promoter were assessed by RNA immunoprecipitation and chromatin immunoprecipitation assays, respectively. The circPVT1/miR-33a-5p/Myc/GLS1 axis was functionally validated in breast cancer patients derived organoids. The viability of 2D and PDO cell models was assessed by ATP light assay and Opera Phenix plus high content screening.

Results: We initially found that the expression of circPVT1 was significantly higher in tumoral tissues than in non-tumoral breast tissues. Basal like breast cancer patients with higher levels of circPVT1 exhibited shorter disease-free survival compared to those with lower expression. CircPVT1 ectopic expression rendered fully transformed MCF-10 A immortalized breast cells and increased tumorigenicity of TNBC cell lines. Depletion of endogenous circPVT1 reduced tumorigenicity of SUM-159PT and MDA-MB-468 cells. 1 H-NMR spectroscopy metabolic profiling of circPVT1 depleted breast cancer cell lines revealed reduced glycolysis and glutaminolitic fluxes. Conversely, MCF-10 A cells stably overexpressing circPVT1 exhibited increased glutaminolysis. Mechanistically, circPVT1 sponges miR-33a-5p, a well know metabolic microRNA, which in turn releases c-MYC activity promoting transcriptionally glutaminase. This activity facilitates the conversion of glutamine to glutamate. CircPVT1 depletion synergizes with GLS1 inhibitors BPTES or CB839 to reduce cell viability of breast cancer cell lines and breast cancer-derived organoids.

Conclusions: In aggregate, our findings unveil the circPVT1/miR-33a-5p/Myc/GLS1 axis as a pro-tumorigenic metabolic event sustaining breast cancer transformation with potential therapeutic implications.

Keywords: Breast cancer; MYC; Metabolism; Non-coding RNAs; Patients derived organoids.


Conflict of interest statement

Declarations. Ethics approval and consent to participate: Generation of patient-derived organoids from breast cancer was approved by institutional review board of Regina Elena National Cancer Institute and appropriate regulatory authorities (approval no. IFO 1270/19). All patients signed an informed consent. Consent for publication: Not applicable. Competing interests: The authors declare no competing interests.

Figures
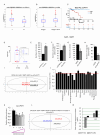
Fig. 1
Fig. 1
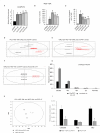
Aberrant expression of circPVT1 elicits pro-tumorigenic effects in breast cancer cells. (A-B) Log2 expression levels of chromosome interval containing circPVT1 in tumor and non-tumoral samples (A) and in stage I and II-III-IV tumor samples (B). (C) Kaplan Meier curves indicating the overall survival of patients basing on the expression level of circPVT1. (D) Boxplots show the copies/μl of circPVT1 in 23 TNBC tumors and in 5 controlateral breast tissues. Highlighted the box plot representing the 5 breast tissue tumors and their corresponding contralateral ones (blu dots). (E, G) Histograms show the number of colonies of SUM-159PT cells either expressing high (E) or low levels (G) of circPVT1. (F, H) Histograms show the number of migrated SUM-159PT cells treated as in E-G. (I) PCA models built on the 1H-NMR dataset of media samples cell extracts from SUM-159PT cell cultures either expressing endogenous or low levels of circPVT1. (J) Histograms show the fold changes of the most discriminant metabolites between the two groups from the PCA models (I). (K) Relative fold enrichment of circPVT1 levels measured in SUM-159PT cells treated with increased concentration of Metformin. (L) PCA models built on the 1H-NMR dataset of media samples cell extracts from SUM-159PT cell cultures either expressing endogenous levels or silenced for circPVT1 and treated or not with 0.5 mM of metformin. (M) t-test applied on LV1 and LV2 component on SUM_siSCR treated with metformin and SUM_sicircPVT
Fig. 2
Fig. 2
Ectopic expression of circPVT1 promotes glutaminolysis in the non-tumorigenic cell line MCF-10 A breast cell line. (A) CircPVT1 RNA relative enrichment levels measured in MCF-10 A stably expressing pcDNA3 or circPVT1. Numbers (#) indicated the different clones of MCF-10 A stably expressing high circPVT1 levels. (B-C) Histograms show number of colonies (B) or of migrated cells (C) count in MCF-10 A treated as in (A). (D-E) PCA (D) and OPLS-DA (E) models built on the 1H-NMR dataset of media samples cell extracts from MCF-10 A cell cultures (clones #1–7) either expressing endogenous or high levels of circPVT1. (F) OPLS-DA model built on the 1H-NMR dataset of media samples cell extracts from MCF-10 A cell clones #4,5 and 7 expressing high levels of circPVT1. (G) Histograms show the fold changes of the most discriminant metabolites between the different groups from the PCA model. (H) PCA model built on the 1H-NMR dataset of cellular extracts from MCF-10 A cell clone #7 either expressing endogenous or high levels of circPVT1. Legend: Black circles, MCF-10 A-circPVT1 cells; white circles, control cells. (I) Histograms show the fold changes of the most discriminant metabolites between the different groups from the PCA model in H
Fig. 3
Fig. 3
CircPVT1 sponges the metabolic miR-33a-5p in breast cancer cells. (A) Upper part, predictive site of binding interaction between miR-33a-5p and circPVT1. Lower part, histograms show the expression levels of miR-33a-5p in MCF-10 A cells treated as in Fig.  2A expressed in fold over empty vector (ev). (B) Upper part, representative protein gel blots of nucleus/cytosol cell lysates obtained from MCF-10 A cells stably expressing pcDNA3 or circPVT1 (clone #7) stained with the indicated antibodies. Lower part, histograms show the levels of circPVT1 between nucleus/cytosol obtained from MCF-10 A treated as in the upper part. (C) Histograms show the expression levels of miR-33a-5p and miR-21-5p measured in SUM-159PT expressing endogenous or high or low levels of circPVT1 or treated with 0.5 mM of metformin. (D) Histograms show the miR-33a-5p relative fold enrichment in SUM-159PT and MCF-10 A circPVT1#7 cells measured in total RNA immunoprecipitated with circPVT1-capture probes. (E-F) Histograms show the fuel oxidation rate of SUM-159PT (E) and MCF-10 A circPVT1#7 cells (F) expressing endogenous or ectopic levels of miR-33a-5p
Fig. 4
Fig. 4
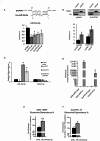
c-MYC mediates circPVT1/miR-33a-5p-induced metabolic alteration in breast cancer cells. (A) Histograms show the c-MYC expression levels measured in MCF-10 A treated as in Fig.  2A. (B) Representative protein gel blots of whole cell lysates extracted from MCF-10 A treated as in Fig.  2A. (C) Histograms show the c-MYC expression levels measured in SUM-159PT expressing endogenous or high or low levels of circPVT1. (D) Representative protein gel blots of whole cell lysates extracted from SUM-159PT cells silenced or not for circPVT1. (E) Histograms show the number of colonies of MCF-10 A clone #7 after c-Myc silencing. (F) Representative cropped protein gel blots of whole cell lysates extracted from MCF-10 A cells depleted or not for c-Myc expression (The uncropped protein gel blot is reported in Fig.S3E). (G) PCA models built on the 1H-NMR dataset of media samples cell extracts from MCF-10 A cell cultures either expressing endogenous or stably expressing high levels of circPVT1 followed silencing of c-MYC or SCR. (H) Histograms show the fold changes of the most discriminant metabolites between the four groups from the PCA models reported in G
Fig. 5
Fig. 5
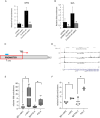
c-MYC regulates transcriptionally GLS1 expression. (A-B) Histograms show the relative c-MYC (A) and GLS (B) expression levels measured in MCF-10 A pcDNA3 and circPVT1 #7 silenced for SCR or c-MYC. (C) Predictive binding region of c-Myc on GLS promoter region. (D) c-Myc protein enrichment on GLS promoter region in MCF-10 A cells from ChIP-seq data deposited on the CistromeDataBase (http://cistrome.org/). (E-F) Relative enrichment of the occupancy of c-Myc p-Ser62 and POL II on the regulatory regions of GLS (-4850: -4811 upstream GLS transcriptional starting site) assessed by Chromatin Immunoprecipitation in MCF-10 A circPVT1 #7 (E) or SUM-159PT (F)
Fig. 6
Fig. 6
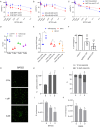
CircPVT1 depletion sensitizes breast cancer cells and TNBC derived organoids to the glutaminase inhibitors BPTES and CB839. (A) Viability curves obtained by measuring ATP levels in SUM-159PT cells silenced or not for circPVT1 and treated for 72 h with increasing doses of BPTES (0–5 μM). (B) Viability curves obtained by measuring ATP levels in MDA-MB-468 cells silenced or not for circPVT1 and treated for 72 h with increasing doses of BPTES (0–5 μM). (C) Viability curves obtained by measuring ATP levels in MCF-10 A circPVT1#7 and treated for 72 h with increasing doses of BPTES (0–5 μM). (D) Relative fold enrichment of circPVT1, miR-33a-5p, c-MYC and GLS among tumoral and matched patients derived organoids (ORG) (n = 3). (E) Relative fold enrichment of miR-33a-5p, c-MYC and GLS following miR-33a-5p overexpression. (F) Histograms show PDOs viability after 72 h of BPTES treatment (1 and 5 μM). (G) Representative images of cytotox positive cells of PDO #240 after 72 h of BPTES treatment at different doses (1 and 5 μM). (H) Histograms show the percentage of cytotox positive organoids after 72 h of BPTES treatment at different doses (1 and 5 μM). (I) Percentage of lived organoids over death organoids after #240 treatment as in G. (J) Percentage of luminescence of PDO #240 organoids treated as in G. (K) Percentage of luminescence of PDO #240 organoids after 72 h of CB839 treatment at different doses (1 and 5 μM)

References

    1. Cao W, Chen HD, Yu YW, Li N, Chen WQ. Changing profiles of cancer burden worldwide and in China: a secondary analysis of the global cancer statistics 2020. Chin Med J (Engl). 2021;134:783–91. - PMC - PubMed
    1. Yin L, Duan JJ, Bian XW, Yu SC. Triple-negative breast cancer molecular subtyping and treatment progress. Breast Cancer Res. 2020;22:61. - PMC - PubMed
    1. Schmid P, Cortes J, Pusztai L, McArthur H, Kummel S, Bergh J, et al. Pembrolizumab for early triple-negative breast cancer. N Engl J Med. 2020;382:810–21. - PubMed
    1. Chen X, Zhou M, Yant L, Huang C. Circular RNA in disease: basic properties and biomedical relevance. Wiley Interdiscip Rev RNA. 2022;13:e1723. - PubMed
    1. Fu B, Liu W, Zhu C, Li P, Wang L, Pan L, et al. Circular RNA circBCBM1 promotes breast cancer brain metastasis by modulating miR-125a/BRD4 axis. Int J Biol Sci. 2021;17:3104–17. - PMC - PubMed

MeSH terms

LinkOut - more resources