. 2025 Aug;21(8):1744-1766.
doi: 10.1080/15548627.2025.2481661. Epub 2025 Apr 1.

TBK1 is a signaling hub in coordinating stress-adaptive mechanisms in head and neck cancer progression

Affiliations

TBK1 is a signaling hub in coordinating stress-adaptive mechanisms in head and neck cancer progression

Hyo Jeong Kim et al. Autophagy. 2025 Aug.

Abstract

Tumorigenesis is closely linked to the ability of cancer cells to activate stress-adaptive mechanisms in response to various cellular stressors. Stress granules (SGs) play a crucial role in promoting cancer cell survival, invasion, and treatment resistance, and influence tumor immune escape by protecting essential mRNAs involved in cell metabolism, signaling, and stress responses. TBK1 (TANK binding kinase 1) functions in antiviral innate immunity, cell survival, and proliferation in both the tumor microenvironment and tumor cells. Here, we report that MUL1 loss results in the hyperactivation of TBK1 in both HNC cells and tissues. Mechanistically, under proteotoxic stress induced by proteasomal inhibition, HSP90 inhibition, or Ub+ stress, MUL1 promotes the degradation of active TBK1 through K48-linked ubiquitination at lysine 584. Furthermore, TBK1 facilitates autophagosome-lysosome fusion and phosphorylates SQSTM1, regulating selective macroautophagic/autophagic clearance in HNC cells. TBK1 is required for SG formation and cellular protection. Moreover, we found that MAP1LC3B is partially localized within SGs. TBK1 depletion enhances the sensitivity of HNC cells to cisplatin-induced cell death. GSK8612, a novel TBK1 inhibitor, significantly inhibits HNC tumorigenesis in xenografts. In summary, our study reveals that TBK1 facilitates the rapid removal of ubiquitinated proteins within the cell through protective autophagy under stress conditions and assists SG formation through the use of the autophagy machinery. These findings highlight the potential of TBK1 as a therapeutic target in HNC treatment.Abbreviations: ALP: autophagy-lysosomal pathway; AMBRA1: autophagy and beclin 1 regulator 1; BaF: bafilomycin A1; CC: coiled-coil; CD274/PDL-1: CD274 molecule; CHX: cycloheximide; CQ: chloroquine; DNP: dinitrophenol; EGFR: epidermal growth factor receptor; ESCC: esophageal squamous cell carcinoma; G3BP1: G3BP stress granule assembly factor 1; HNC: head and neck cancer; HPV: human papillomavirus; IFN: interferon; IGFBP3: insulin like growth factor binding protein 3; IRF: interferon-regulatory factor 3; KO: knockout; LAMP1: lysosomal associated membrane protein 1; MAP1LC3B: microtubule associated protein 1 light chain 3 beta; NPC: nasopharyngeal carcinoma; PABP: poly(A) binding protein; PI: proteasome inhibitor; PQC: protein quality control; PROTAC: proteolysis-targeting chimera; PURA/PURα: purine rich element binding protein A; RIGI: RNA sensor RIG-I; SD: standard deviation; SG: stress granule; SQSTM1: sequestosome 1; STING1: stimulator of interferon response cGAMP interactor 1; TBK1: TANK binding kinase 1; UPS: ubiquitin-proteasome system; USP10: ubiquitin specific peptidase 10; VCP: valosin containing protein; VHL: von Hippel-Lindau tumor suppressor; WT: wild type.

Keywords: Autophagic flux; GSK8612; MUL1; TBK1; head and neck cancer; stress granule formation.


Conflict of interest statement

No potential conflict of interest was reported by the author(s).

Figures

Figure 1.
Figure 1.
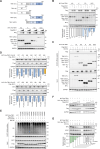
MUL1 is novel negative regulator of TBK1. (A) TBK1 or MUL1 expression levels were different between tissues from human head and neck cancer (T) and their adjacent non-tumor head and neck (N). Proteins were isolated from tissues of 14 patients with HNC, and p-TBK1, TBK1, or MUL1 expression levels were determined by western blot. (B) Quantification of the p-TBK1:GAPDH, TBK1:GAPDH, and MUL1:GAPDH (14-pair HNC cohort, **p = 0.0058, ****p < 0.0001 by the Mann-Whitney t test). (C) WT or MUL1 KO FaDu cells were treated with PI+Tg (10 nM bortezomib +100 nM thapsigargin) for the indicated time periods, and subject to western blot. (D) WT or MUL1 KO FaDu cells were treated with 20 μg/ml cycloheximide (CHX) and 10 nM PI +100 nM tg for the indicated times, and subjected to western blot. (E) MUL1 induces TBK1 degradation by the UPS. MYC-His-TBK1 was transfected into MUL1 KO FaDu cells together with or without flag-MUL1. Cells were treated with 10 μM MG132, 10 nM bortezomib, 10 μM lactacystin, or 250 nM epoxomicin for 12 h. (F) TBK1 interacts with MUL1. At 24 h after co-transfection with the indicated plasmids, MUL1 KO FaDu cells were treated with 10 μM MG132 for 8 h before cell harvest and then subjected to Ni-nta affinity-isolation under denaturing conditions. The obtained affinity-isolated samples were subjected to western blot using the indicated antibodies. (G) WT or MUL1 KO FaDu cells were transfected with NC or STING1 siRNA for 24 h, followed by incubation with 10 nM PI +100 nM tg for 30 h. (H) Endogenous p-TBK1 ubiquitination assay. WT or MUL1 KO FaDu cells were treated with 10 nM PI +100 nM tg for the indicated time, followed by ubiquitination assays for analysis with an anti-FK2 antibody. (I) MUL1 induces K48-linked ubiquitination of TBK1. MUL1 KO FaDu cells were transfected MYC-His-TBK1 and flag-MUL1 together with HA-WT ub or ubiquitin mutants (HA-Ub-K48, HA-Ub-K63, HA-UbK48R, or HA-UbK63R). Ubiquitinated TBK1 was identified by Ni-nta affinity-isolation assays for analysis with an anti-ha antibody. (J) MUL1 preferentially induces degradation in active TBK1. Active TBK1 (MYC-His-wt TBK1) or inactive TBK1 (MYC-His-TBK1S172A) were co-transfected with flag-MUL1 plasmids (0, 0.25, 0.5, or 1 μg) in MUL1 KO FaDu cells. (K) Activated TBK1 is efficiently ubiquitinated by MUL1. After transfection with plasmids as indicated, MUL1 KO FaDu cells were treated with 10 μM MG132 and then subjected to Ni-nta affinity-isolation ubiquitination assays. (L) Colocalization of EGFP-MUL1 (green), COX4l1 (red), and HSPD1/HSP60 (far red) with or without 20 nM PI +100 nM tg treatment for 12 h in MUL1 KO FaDu cells. (M) Colocalization of EGFP-MUL1 (green), mitochondria (red), and MYC-His-TBK1 (far red) with or without 20 nM PI +100 nM tg treatment for 12 h in MUL1 KO FaDu cells. Mitochondria were labeled with MitoTracker red CMXRos dye. Images were obtained using a nikon N-SIM confocal microscope and overlaid to assess protein localization. Scale bars: 10 μm and 1 μm (inset). (N) The percentages of TBK1 containing colocalization of mitochondria (COX4l1 and HSPD1/HSP60) per field. The data represent the mean ± SD of 25 fields, each of which contains at least 4 cells that meet statistical requirements, from three independent experiments. (O) Quantification of the colocalization of TBK1 and MUL1 signal. Merged images from (M) were analyzed for TBK1 and MUL1 colocalization using NIS Elements software and Pearson’s correlation coefficient. The data represent the mean ± SD of 40 fields, each of which contains at least 4 cells that meet statistical requirements, from three independent experiments. ****p < 0.0001 by unpaired t test.
Figure 2.
Figure 2.
Lysine 584 of TBK1 is a site of MUL1-mediated K48-linked ubiquitination. (A) top, the functional domain structure and map of the plasmids of the TBK1 deletion mutant. Bottom, overexpression of MUL1 induces degradation of TBK1 at the C terminus region in a dose-dependent manner. A series of TBK1 deletion constructs were co-transfected with flag-MUL1 plasmids (0, 0.5, or 1 μg) in MUL1 KO FaDu cells. (B) MUL1 induces UPS targeting of TBK1 at the C terminus region. MUL1 KO FaDu cells were transfected flag-MUL1 together with each indicated plasmid. After 24 h, 10 μM MG132 treatment was given for 8 h before cell harvest. Each TBK1 protein level was determined by an anti-myc antibody. Quantification of the MYC:GAPDH (n = 3; ****p < 0.0001, *p < 0.05, ns; non-significant). (C) MUL1 binds to the coiled-coil domain of TBK1. A series of TBK1 deletion constructs were co-transfected with flag-MUL1 at MUL1 KO FaDu cells. After 24 h, the cells were treated with 10 μM MG132 for 8 h before cell harvest. Subsequently, Ni-nta affinity-isolation was performed under denaturing conditions to isolate the protein complexes. The obtained pull-down samples were subjected to western blot using the indicated antibodies. (D) lysine 584 (K584) of TBK1 is a putative site for degradation by MUL1. Twelve lysine (K) residues in the C terminus of TBK1 were replaced with alanine (R) by site-direct mutagenesis assay and each indicated plasmid was transfected into MUL1 KO FaDu cells together with flag-MUL1. After 24 h, the level of each mutant (K to R) TBK1 protein was analyzed with an anti-myc antibody. Quantification of the MYC:GAPDH (n = 3; ****p < 0.0001, ***p < 0.001, **p < 0.01, *p < 0.05, ns; non-significant). (E) TBK1 lysine (K) residues, K584 is a putative ubiquitination site for MUL1. Twelve lysine (K) residues were replaced with alanine (R), and each indicated plasmids were transfected into MUL1 KO FaDu cells. Cells were treated with 10 μM MG132 for 8 h and further subjected to Ni-nta affinity-isolation ubiquitination assay. (F) the effect of MUL1 on TBK1 protein stability is inhibited in the TBK1K584R mutant, compared to WT TBK1. MYC-His-wt TBK1 or MYC-His-TBK1K584R were transfected into MUL1 KO FaDu cells together with or without flag-MUL1 dose dependently and 24 h later, the level of each indicated protein was determined by western blot. (G) the half-life of the TBK1K584R mutant protein is compared with the WT TBK1. MYC-His-wt TBK1 or MYC-His-TBK1K584R were transfected into MUL1 KO FaDu cells and 24 h later, treatment of 20 μg/ml CHX was included for each indicated time. Endogenous MUL1 or exogenous TBK1 were detected using anti-MUL1 or anti-myc antibodies. Quantification of the MYC:GAPDH (n = 3; **p < 0.01, *p < 0.05, ns; non-significant).
Figure 3.
Figure 3.
HSP90 inhibition lead to the degradation of active TBK1 by MUL1. (A) 17AAG treatment significantly reduces p-TBK1 and TBK1 levels in WT cells but not in MUL1 KO FaDu cells. The cells were treated with 0, 0.25, 0.5, 1, or 2 μM 17AAG for 24 h. (B) Same as in (A), the cells were treated with 0, 0.5, 1, or 2 μM AUY922 for 24 h, and the effects on p-TBK1 and TBK1 levels were measured. (C) TBK1 levels are reduced by HSP90 knockdown. FaDu cells were transfected with NC or HSP90 siRNAs for 48 h, and the levels of endogenous p-TBK1 and TBK1 were examined by western blot. (D) FaDu cells were transfected with pCMV-flag or flag-MUL1 for 24 h. The cells were treated with 0, 0.5, 1, or 2 μM 17AAG for 24 h. (E) FaDu cells were transfected with MYC-His-TBK1 for 24 h. The cells were then incubated for an additional 8 h in the presence of 2 μM 17AGG or 1 μM HSP990 alone or combined with 10 μM MG132 or 100 nM BaF, and analyzed by western blot. (F) FaDu cells were transfected with MYC-His-TBK1 for 24 h. Where indicated, cells were treated with either 1 μM 17AAG or 20 μM GSK8612 in combination with 10 μM MG132 for 4 h. Cells were lysed and subjected to Ni-nta affinity-isolation under denaturing conditions. Levels of MYC-His-TBK1 and endogenous HSP90 are shown in the input and bead fractions. (G) FaDu cells were transfected with MYC-His-wt TBK1, MYC-His TBK1S172A, or MYC-His-TBK1K38A. at 24 h transfection, cells were treated with 1 μM 17AAG for 24 h and analyzed by western blot. (H) FaDu cells were transfected MYC-His-TBK1 together with HA-Ub. After 24 h, cells were treated with 1 μM 17AAG or 1 μM HSP990 combined with 10 μM MG132 for 12 h, and then subjected to Ni-nta affinity-isolation ubiquitination assay under denaturing conditions. The obtained affinity-isolation samples were subjected to western blot using an anti-ha antibody. (I) After transfecting FaDu cells with NC or MUL1 siRnas, and either MYC-His-wt TBK1, MYC-His TBK1S172A, or MYC-His-TBK1K38A. Cells were treated for 12 h with 1 μM 17AAG alone or combined with 10 μM MG132, and then subjected to Ni-nta affinity-isolation ubiquitination assay, followed by western blot with an anti-ha antibody. (J) Schematic model showing how HSP90 could regulate TBK1 stability and activity.
Figure 4.
Figure 4.
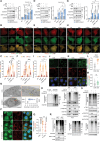
TBK1 depletion inhibits autophagosome degradation by suppressing the fusion of autophagosome with lysosome. (A) Western blot analysis of FaDu cells transfected with NC or TBK1 siRnas. After 24 h, proteasome inhibitor (PI; 20 nM bortezomib) was added, and the cells were incubated for an additional 8 h. Left; representative western blot, right; quantification of the SQSTM1 and MAP1LC3B levels (n = 4; SQSTM1, ****p < 0.0001, *p = 0.0172, ****p < 0.0001 vs. NC, ###p = 0.0012; siTBK1 vs. siTBK1+PI, and MAP1LC3B, *p = 0.0491, ****p < 0.0001 vs. NC, #p = 0.0416; siTBK1 vs. siTBK1+PI by unpaired t test. (B) Representative fluorescence photographs of FaDu cells expressing mCherry-GFP-LC3 reporter. NC or TBK1-knockdown cells were treated with 20 nM PI for 8 h. Scale bar: 10 μm. (C) the bar graph represents the quantitative analysis of the area of autophagosomes (APs; yellow puncta) and autolysosomes (ALs; red-only puncta) per cell. (n = 3; ****p < 0.0001 vs. NC, ###p = 0.0003; siTBK1 vs. siTBK1+PI for APs, and ****p < 0.0001 vs. NC, ####p < 0.0001; siTBK1 vs. siTBK1+PI for ALs). (D) FaDu cells were transfected with NC or TBK1 siRNAs for 24 h, followed by incubation with 1 μM torin1 for 8 h. Left; representative western blot, right; quantification of the SQSTM1 and MAP1LC3B levels (n = 4; SQSTM1, ****p < 0.0001, *p = 0.0140, *p = 0.0335 vs. NC, ns; non-significant, and MAP1LC3B, ***p = 0.0009, ***p = 0.0006, ***p = 0.0003 vs. NC, #p = 0.0370; siTBK1 vs. siTBK1+torin1 by unpaired t test). (E) Representative fluorescence photographs of FaDu cells expressing mCherry-GFP-LC3 reporter. NC or TBK1-knockdown cells were treated with 1 μM torin1 for 8 h. Scale bar: 10 μm. (F) the bar graph represents the quantitative analysis of the area of autophagosomes (APs; yellow puncta) and autolysosomes (ALs; red-only puncta) per cell. (n = 3; ****p < 0.0001 vs. NC, ####p < 0.0001; siTBK1 vs. siTBK1+torin1 for APs, and ****p < 0.0001 vs. NC, ####p < 0.0001; siTBK1 vs. siTBK1+torin1 for ALs). (G) FaDu cells were transfected with NC or TBK1 siRNAs for 24 h, followed by incubation with 50 nM BaF for 6 h. (H) Representative fluorescence photographs of FaDu cells expressing mCherry-GFP-LC3 reporter. NC or TBK1-knockdown cells were treated with 50 nM BaF for 6 h. (I) the bar graph represents the quantitative analysis of the area of autophagosomes (APs; yellow puncta) and autolysosomes (ALs; red-only puncta) per cell. (n = 3; ****p < 0.0001 vs. NC, ns; non-significant for APs, and ****p < 0.0001 vs. NC, ns; non-significant for ALs). (J, k) FaDu cells were treated with 20 μM GSK8612 for 24 h, and then the cells were fixed. They were then labeled with (J) antibodies to SQSTM1 (green) or MAP1LC3B (red), and (K) antibodies to MAP1LC3B (green) or LAMP1 (red), prior to capturing the images by confocal microscopy. Yellow; merge/colocalization. Scale bars: 10 μm. (L) quantification of the colocalization of SQSTM1 and MAP1LC3B signal. Merged images from (J) were analyzed for SQSTM1:MAP1LC3B colocalization using NIS Elements software and Pearson’s correlation coefficient. The data represent the mean ± SD of 40 fields, each of which contains at least 4 cells that meet statistical requirements, from three independent experiments. ****p < 0.0001 by unpaired t test. (M) quantification of the colocalization of MAP1LC3B and LAMP1 signal. Merged images from (K) were analyzed for MAPLC3B:LAMP1 colocalization using NIS Elements software and Pearson’s correlation coefficient. The data represent the mean ± SD of 40 fields, each of which contains at least 4 cells that meet statistical requirements, from three independent experiments. (N) electron microscopy of FaDu cells after treatment with 20 μM GSK8612 for 36 h. Arrowheads indicate autophagosomes with double membranes. Scale bars: 10 μm and 1 μm (inset). Quantification of the number of autophagic vacuoles per cell (n = 40). ****p < 0.0001 by unpaired t test. (O) FaDu cells were treated with 20 nM PI in combination with 100 nM thapsigargin (tg) for 16 h (pre), then media were switched to complete cell media, in combination with 20 μM GSK8612 for 24 h (post). The interaction between SQSTM1 and ub conjugates (FK2 antibody) was assessed by immunoprecipitation with an anti-SQSTM1 antibody. (P) Colocalization assay with antibodies specific to ub conjugates (FK2 antibody; green) and SQSTM1 (red) in FaDu cells treated with 20 nM PI and/or 20 μM GSK8612 for 24 h. Scale bar: 10 μm. (Q) Quantification of the colocalization of ub conjugates and SQSTM1 signal in cytosol. Merged images from (P) were analyzed for ub conjugates:SQSTM1 colocalization using NIS Elements software and Pearson’s correlation coefficient (5 fields, each field has at least 6 cells that meet statistical requirements. n = 3, ****p < 0.0001; CON vs. PI, **p = 0.0012; PI vs. PI+GSK8612 by unpaired t test). (R) Autophagy might be the main route to proteolytically remove cellular oxidatively damaged (carbonylated) proteins. Atg5+/+ and atg5−/− MEFs were transfected with mock or his-ub, cultured for 36 h. Carbonylated proteins were visualized through derivatization with DNPH, followed by western blot with an anti-dnp antibody. (S) GSK8612 inhibited autophagy activation induced by Ub+ stress, which is caused by overexpression of ub. FaDu cells were transfected with mock or his-ub, cultured for 36 h. Carbonylated proteins were visualized through derivatization with DNPH, followed by western blot with an anti-dnp antibody.
Figure 5.
Figure 5.
High levels of G3BP1 and PABP expression were found in HNC. (A) G3BP1 and PABP expression from both HNC tissues (T) and their adjacent non-tumor head and neck tissues (N) were analyzed using western blotting. Representative western blot with anti-G3BP1 and anti-pabp antibodies, GAPDH as loading control. Quantification of the G3BP1:GAPDH (B) and PABP:GAPDH (C) (14-pair HNC cohort, ****p < 0.0001 by the mann-whitney t test). (D) A digital histologic image of a hematoxylin and eosin (H&E)-stained slide of squamous cell carcinoma (SCC) at the oral cavity (tongue). Representative immunofluorescence staining of G3BP1 (green) and PABP (red) was performed to determine the SG formation in HNC tissues and adjacent non-tumor head and neck tissues (yellow; merge/colocalization, 10-pair HNC cohort). Scale bar: 200 μm and 20 μm (inset). (E) the average percentage of cells with G3BP1 and pabp-positive SGs in tumor tissues was counted. Average percentages of SGs ± SD for each tumor is plotted based on individual values. The colocalization of G3BP1 and PABP signal in cytosol was quantified by analyzing the merged images from (D) using NIS Elements software (5 fields of view imaged at 60× in each of 10-pair HNC tissues, ****p < 0.0001 by the Mann-Whitney t-test).
Figure 6.
Figure 6.
TBK1 inhibition impairs SG formation and sensitizes HNC cells to cisplatin. (A) FaDu cells were pre-treated with 1 μM 17AGG or 20 μM GSK8612 for 3 h. Then, 20 μM MG132 was added, and the cells were incubated for an additional 6 h. After that, the cells were fixed and representative immunofluorescence staining for G3BP1 (green) and PABP (red) was performed in FaDu cells to determine the SG formation. Scale bar: 10 μm. (B) The average percentage of cells with G3BP1 and pabp-positive SGs was counted (n = 10 fields, each field has at least 8 cells that meet statistical requirements). Average percentages of SGs and SD for three independent experiments are plotted. **p = 0.0013, ****p < 0.0001 by unpaired t test. (C) FaDu cells were transfected with NC or TBK1 siRnas. After 24 h, 20 μM MG132 was added, and the cells were incubated for an additional 6 h. Cells were fixed and labeled with anti-G3BP1 and anti-pabp antibody. Scale bar: 10 μm. (D) The average percentage of cells with G3BP1 and pabp-positive SGs was counted (n = 10 fields). Average percentages of SGs and SD for three independent experiments are plotted. **p = 0.0066 by unpaired t test. (E) FaDu cells treated for 6 h with 20 μM MG132 alone or with chloroquine (CQ) were fixed and labeled with anti-G3BP1 and anti-pabp antibody. Scale bar: 10 μm. (F) The average percentage of cells with G3BP1 and pabp-positive SGs was counted (n = 10 fields). Average percentages of SGs and SD for three independent experiments are plotted. ****p < 0.0001 by unpaired t test. (G) FaDu cells were transfected with NC, MAP1LC3B, ATG5, or SQSTM1 siRnas. After 24 h, 20 μM MG132 was added, and the cells were incubated for an additional 6 h. Cells were fixed and labeled with anti-G3BP1 and anti-pabp antibody. Scale bar: 10 μm. (H) The average percentage of cells with G3BP1 and pabp-positive SGs was counted (n = 10 fields). Average percentages of SGs and SD for three independent experiments are plotted. **p = 0.0019, **p = 0.0034 vs. NC by unpaired t test. (I) FaDu cells were pre-treated with 100 nM BaF for 3 h. Then, 20 μM MG132 was added, and the cells were incubated for an additional 6 h. After that, the cells were fixed and representative immunofluorescence staining for G3BP1 (red) and MAP1LC3B (green) or SQSTM1 (red) and PABP (green) was performed in FaDu cells to determine the SG formation. Scale bar: 10 μm and 1 μm (inset). (M) HNC cells transfected with NC or TBK1 siRNAs were treated with 10 μM cisplatin for 24 h, and apoptosis was measured by ANXA5/Annexin V and PI flow cytometry (n = 3, unpaired t-test). (N) HNC cells transfected with NC or TBK1 siRNAs were treated with 0, 1, 2.5, 5, or 10 μM cisplatin for 24 h and analyzed by western blot using anti-p-TBK1, anti-TBK1, and anti-cleaved CASP3 antibodies, with GAPDH as loading control. (O) FaDu cells transfected with NC, TBK1, ATG5, or G3BP1 siRNAs were treated with 10 μM cisplatin for indicated time (24 h or 48 h), and cell viability was measured using the CCK-8 assay (n = 3). For 24 h, ***p = 0.0008, ****p < 0.0001, and ***p = 0.0003 vs. NC; **p = 0.0067, and ***p = 0.0008 vs. cis; ##p = 0.0080 (siTBK1+cis vs. siATG5+cis); and #p = 0.0415 (siTBK1+cis vs. siG3BP1+cis). For 48 h, ****p < 0.0001, **p = 0.0014, and ***p = 0.0001 vs. NC; ***p = 0.0003, *p = 0.0299, and ***p = 0.0002 vs. cis; ##p = 0.0031 (siTBK1+cis vs. siATG5+cis); ns (non-significant) for siTBK1+cis vs. siG3BP1+cis, determined by unpaired t-test. (P) FaDu cells transfected with NC, TBK1, ATG5, or G3BP1 siRNAs were treated with 10 μM cisplatin for 48 h. Protein expression levels were analyzed by western blot using antibodies against p-TBK1, TBK1, and cleaved CASP3, with GAPDH serving as the loading control.
Figure 7.
Figure 7.
GSK8612 inhibition impairs autophagic flux, SG formation and tumor growth in HNC xenograft. (A) subcutaneous injection of 5 × 106 FaDu cells was performed in BALB/c nu/nu mice, followed by oral administration of GSK8612 every day for 10 days. Data are mean tumor volume at endpoint ± SD and individual tumor volume for each mouse. CON n = 7, GSK8612 n = 9. **p < 0.01 by the mann-whitney t test. (B) top, the endpoint images of tumors formed by CON and GSK8612 in BALB/c mice. Bottom, data are mean tumor weight at endpoint ± SD and individual tumor weights for each mouse. CON n = 7, GSK8612 n = 9. **p = 0.0046 by the mann-whitney t test. (C) data are mean body weight at endpoint ± SD. ns; non-significant by the mann-whitney t test. (D) proteins isolated from tumor tissues from (A) were subjected to western blot analysis using the indicated antibodies, GAPDH as loading control. (E) the amounts of p-TBK1 (***p = 0.0006 by the mann-whitney t test), TBK1 (ns; non-significant), p-SQSTM1 (**p = 0.0070 by the mann-whitney t test), SQSTM1 (*p = 0.0111 by the mann-whitney t test), MAP1LC3B (*p = 0.0379 by the mann-whitney t test), and cleaved CASP3 (***p = 0.0006 by the mann-whitney t test) were measured and normalized to GAPDH. CON n = 7 and GSK8612 n = 7. (F) colocalization of SQSTM1 (green) and MAP1LC3B (red) in tumor sections. Arrowheads, autophagosomes (yellow). Scale bar: 10 μm. (G) the average percentage of cells with the SQSTM1+MAP1LC3B+ puncta per field (n = 10 fields, each field has at least 20 cells that meet statistical requirements). Average percentages of autophagosomes ± SD for each tumor is plotted based on individual values. CON n = 7, GSK8612 n = 7. ***p = 0.0006 by the mann-whitney t test. (H) Representative immunofluorescence staining for G3BP1 (green) and PABP (red) in tumors. Scale bar: 20 μm and 10 μm (inset). (I) the average percentage of cells with G3BP1 and pabp-positive SGs in tumor tissues was counted (n = 4 fields, each field has at least 100 cells that meet statistical requirements). Average percentages of SGs ± SD for each tumor is plotted based on individual values. CON n = 7, GSK8612 n = 7. **p = 0.0070 by the mann-whitney t test. (J) Representative immunofluorescence staining of MKI67 (green)- or cleaved CASP3 (red)-positive areas in tumors. Scale bar: 100 μm. (K) quantification of MKI67- or cleaved CASP3-positive areas in tumors. The values for each tumor represent the average of 10 fields of view imaged at 20× and covering ~ 50% of each section. Data are mean MKI67 or cleaved CASP3 area over tumor area ± SD of individual tumors in mice. CON n = 7, GSK8612 n = 7. ***p = 0.0006 by the mann-whitney t test.

References

    1. Luo J, Solimini NL, Elledge SJ.. Principles of cancer therapy: oncogene and non-oncogene addiction. Cell. 2009;136(5):823–837. - PMC - PubMed
    1. Morán Luengo T, Mayer MP, Rüdiger SGD. The Hsp70–Hsp90 chaperone cascade in protein folding. Trends Cell Biol. 2019;29(2):164–177. doi: 10.1016/j.tcb.2018.10.004 - DOI - PubMed
    1. Pohl C, Dikic I. Cellular quality control by the ubiquitin-proteasome system and autophagy. Science. 2019;366(6467):818–822. doi: 10.1126/science.aax3769 - DOI - PubMed
    1. Thedieck K, Holzwarth B, Prentzell MT, et al. Inhibition of mTORC1 by astrin and stress granules prevents apoptosis in cancer cells. Cell. 2013;154(4):859–874. doi: 10.1016/j.cell.2013.07.031 - DOI - PubMed
    1. Moon SL, Morisaki T, Stasevich TJ, et al. Coupling of translation quality control and mRNA targeting to stress granules. J Cell Biol. 2020;219(8):e202004120. doi: 10.1083/jcb.202004120 - DOI - PMC - PubMed

Substances