. 2025 Apr 1;18(4):dmm052024.
doi: 10.1242/dmm.052024. Epub 2025 Apr 28.

Microvascular aberrations found in human polycystic kidneys are an early feature in a Pkd1 mutant mouse model

Affiliations

Microvascular aberrations found in human polycystic kidneys are an early feature in a Pkd1 mutant mouse model

Daniyal J Jafree et al. Dis Model Mech. .

Abstract

Therapies targeting blood vessels hold promise for autosomal dominant polycystic kidney disease (ADPKD), the most common inherited disorder causing kidney failure. However, the onset and nature of kidney vascular abnormalities in ADPKD are poorly defined. Accordingly, we employed a combination of single-cell transcriptomics; three-dimensional imaging with geometric, topological and fractal analyses; and multimodal magnetic resonance imaging with arterial spin labelling to investigate aberrant microvasculature in ADPKD kidneys. Within human ADPKD kidneys with advanced cystic pathology and excretory failure, we identified a molecularly distinct blood microvascular subpopulation, characterised by impaired angiogenic signalling and metabolic dysfunction, differing from endothelial injury profiles observed in non-cystic human kidney diseases. Next, Pkd1 mutant mouse kidneys were examined postnatally, when cystic pathology is well established, but before excretory failure. An aberrant endothelial subpopulation was also detected, concurrent with reduced cortical blood perfusion. Disorganised kidney cortical microvasculature was also present in Pkd1 mutant mouse fetal kidneys when tubular dilation begins. Thus, aberrant features of cystic kidney vasculature are harmonised between human and mouse ADPKD, supporting early targeting of the vasculature as a strategy to ameliorate ADPKD progression.

Keywords: Magnetic resonance imaging; Nephrology; Perfusion; Single-cell RNA sequencing; Three-dimensional microscopy; Vasculature.


Conflict of interest statement

Competing interests The authors declare no competing or financial interests.

Figures

Fig. 1.
Fig. 1.
A single-cell RNA-sequencing census of blood vasculature in the human kidney. (A) Schematic of kidney blood vascular subsets including arteries, afferent (AffArt) and efferent (EffArt) arterioles, glomerular endothelial cells (GEC), peritubular capillaries (PTC), ascending vasa recta (AVR) and descending vasa recta (DVR). The nephron (yellow) is shown for spatial orientation. (B) Uniform manifold approximation and projection (UMAP) of 41,546 blood endothelial cells (ECs) from 64 human kidneys using publicly available single-cell RNA sequencing (scRNA-seq) data. Seven clusters correspond to annotations in A, with an additional inflammation-activated EC (ECInj) cluster. (C) Heatmap showing ten differentially expressed genes (DEGs) per cluster, with high (yellow) and low (purple) expression coloured. Cluster territories are indicated on the right. (D-F) UMAP and immunofluorescence validation of vascular markers. (D) SSUH2 is a marker of AffArt (log2FC=2.19, P<0.0001) and expressed in CD31+ vessels adjacent to glomeruli, containing GEC. (E) FBLN2 is a marker of DVR (log2FC=1.55, P<0.0001), expressed in CD31+ medullary vessels with PDGFRβ+ pericyte coverage. (F) GPM6A is a marker of AVR (log2FC=1.24, P=1.17×10−68), expressed in CD31+ medullary vessels without PDGFRβ+ pericyte coverage. Images represent five slides across n=3 human kidneys. Scale bars: 50 μm.
Fig. 2.
Fig. 2.
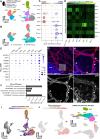
Single-nucleus RNA sequencing of human end-stage autosomal dominant polycystic kidney disease demonstrates a molecularly distinct kidney blood endothelial subpopulation in cystic kidneys. (A) UMAP of single-nucleus RNA-sequencing (snRNA-seq) data derived from 3780 blood EC nuclei from five control and eight autosomal dominant polycystic kidney disease (ADPKD) kidney tissues, revealing eight transcriptionally distinct clusters, including a unique cluster (grey) termed ECPKD. (B) UMAP from A, grouped by sample to illustrate cell-type abundance. (C) Differential abundance analysis (computed using miloR), showing distributions of each cellular ‘neighbourhood’ within the samples and overabundance of ECInj, ECPKD and DVR in ADPKD. (D) Random forest classification (computed using SingleCellNet) comparing ADPKD kidney ECs to a scRNA-seq reference (Fig. 1), with heatmap intensity indicating transcriptional similarity. (E) Dot plot of the top DEGs in ECPKD, with dot size representing the proportion of expressing cells and colour intensity indicating expression level. (F) Gene Ontology (GO) analysis of ECPKD DEGs, with GO terms (y-axis) and false discovery rate (FDR; x-axis). (G) Confocal microscopy of ADPKD kidney tissues stained for CD31 and SPP1. Dashed line marks SPP1+ cyst epithelium; the transparent box highlights the region shown in H. Scale bar: 100 μm. (H) High-magnification image from G, showing SPP1 expression in CD31+ vasculature (arrowheads). Single-colour panels for CD31 (bottom left) and SPP1 (bottom right) are also shown. Scale bar: 100 μm. (I) Pseudotime trajectory analysis performed using the monocle3 package in R. The UMAP is identical to that shown in A and B. The overlaid trajectory line represents the predicted cellular progression from PTC through ECInj to ECPKD. Cells are coloured by pseudotime, with purple indicating the root (earliest state) and yellow marking the terminal state. (J) Analysis of ECPKD module score expression in the snRNA-seq and scRNA-seq EC atlases. Using the snRNA-seq ADPKD EC atlas, the top 50 DEGs of ECPKD were used to calculate a module score in Seurat (left). The expression of this module score was then assessed within the scRNA-seq kidney EC dataset (top right), with scant expression across EC cells in this dataset (bottom right).
Fig. 3.
Fig. 3.
Molecular changes to blood vasculature in a mouse model of ADPKD at an intermediate disease stage. (A) Periodic acid–Schiff staining of Pkd1 p.R3277C (RC) mouse kidneys at 3 and 12 months in wild-type (Pkd1+/+) or homozygous (Pkd1RC/RC) littermates. Cysts are indicated with arrowheads. Representative of four slides per kidney (n=4 mice per group). Scale bar: 100 μm. DT, distal tubule; G, glomerulus; PT, proximal tubule. (B) Blood urea nitrogen (BUN) levels in Pkd1RC/RC mice over time. Each point represents an individual mouse. One-way ANOVA showed significant differences (F=2.6, P=0.049), with Tukey's post hoc test identifying significance between 3 and 12 months (P=0.023). (C) 3D rendering of lightsheet microscopy from a 3-month-old Pkd1RC/RC kidney. Cysts (coloured) are mainly cortical, with size mapped from small (purple, <0.04 mm³) to large (red, >0.5 mm³). Arrowheads indicate cysts; asterisks mark adjacent regions. The analysis was repeated in three kidneys, each from a separate mouse. (D,E) Representative confocal microscopy of Pkd1+/+ (D) and Pkd1RC/RC (E) kidneys at 3 months, stained for EMCN and SPP1. In D, asterisks indicate nonvascular SPP1 expression; in E, arrowheads mark SPP1+ vasculature. Scale bars: 50 µm. (F) Quantification of SPP1 fluorescence from D and E. Left: each point represents a tissue region (n=3 per group). Right: vessel-specific analysis, with each point showing mean fluorescence from ten vessel branches. Unpaired two-tailed Student's t-test revealed significant differences in overall SPP1 expression (mean difference 13.6±6.0, 95% c.i.=0.66-26.5, P=0.041) and vascular SPP1 (mean difference=33.6±3.6, 95% c.i.=24.8-40.3. P<0.0001). *P<0.0332, ****P<0.0001.
Fig. 4.
Fig. 4.
3D geometric, fractal and topological analysis of the kidney cortical blood microvasculature in a mouse model of ADPKD at an intermediate disease stage. (A,B) 3D reconstructions of endomucin (EMCN)+ vasculature in vibratome slices from Pkd1+/+ (A) and Pkd1RC/RC (B) kidneys at 3 months of age, stained with Tomato lectin (LEL) to distinguish tubules and cortical–medullary orientation. The Pkd1RC/RC kidney shows regions of sparse (dashed lines) and dense (asterisks) vascularisation. Scale bars: 50 μm. (C,D) Vessel geometry quantification of EMCN+ cortical vasculature using VesselVio in Pkd1+/+ (C) and Pkd1RC/RC (D) kidneys. Wire skeletons are colour-coded by branch length. (E-G) 3D analysis of the cortical vasculature including geometric analysis (E), with quantification of vessel radius, length and density (vessel branches per mm³). Unpaired two-tailed Student's t-test showed no significant differences between groups. (F) Fractal analysis, including vascular structure, including fractal dimension, lacunarity, and connectivity. Lacunarity was significantly different between groups (mean difference=0.079±0.028, 95% c.i.=0.020-0.14, P=0.012). (G) Topological analysis of Betti 1, persistence entropy, and average lifetime. Pkd1RC/RC kidneys showed significant differences in Betti 1 (mean difference=1711±604.3, 95% c.i.=435.9-604.3, P=0.012) and persistence entropy (mean difference=0.48±0.15, 95% c.i.=0.16-0.81, P=0.006). In A-D, images are representative of n=4 kidneys per group at 3 months of age, with ≥3 regions scanned per kidney. In E-G, each point represents a region of interest imaged, pooled across n=4 mice per group. *P<0.0332, **P<0.0021.
Fig. 5.
Fig. 5.
3D geometric, fractal and topological analysis of the kidney cortical blood microvasculature in a mouse model of ADPKD at a fetal stage. (A,B) 3D reconstructions of endomucin (EMCN)+ vasculature in vibratome slices from Pkd1+/+ (A) and Pkd1RC/RC (B) kidneys at embryonic day (E)18.5. Scale bars: 500 μm. (C,D) z-sections of autofluorescence (top row, grey) and EMCN+ vasculature (bottom row, red) from Pkd1+/+ (C) and Pkd1RC/RC (D) kidney cortex. Autofluorescence of cortical tubular epithelium (asterisks) in Pkd1+/+ kidneys and tubule dilation (arrowheads) in Pkd1RC/RC kidneys are shown. Scale bars: 100 μm. (E,F) Vessel geometry quantification of EMCN+ cortical vasculature using VesselVio in Pkd1+/+ (E) and Pkd1RC/RC (F) fetal kidneys, with wire skeletons colour-coded by branch length. (G-I) 3D analysis of the cortical vasculature at E18.5, including geometric analysis. (G) Pkd1RC/RC kidneys showed increased vessel radius (mean difference=0.39±0.12, 95% c.i.=0.14-0.65, P=0.004) and branch length (mean difference=0.89±0.26, 95% c.i.=0.36-1.42, P=0.002), and a decrease in vascular density (mean difference=22±6, 95% c.i.=10-34, P=0.0007). (H) 3D fractal analysis (fractal dimension, lacunarity, connectivity) showed no significant differences between groups. (I) 3D topological analysis (Betti 1, persistence entropy, average lifetime) also showed no significant differences. All images in A-F are representative of n=4 kidneys per group at E18.5, and each point in G-I represents an individual region of interest from images pooled across n=4 kidneys. **P<0.0021, ***P<0.0002 (unpaired two-tailed Student's t-test).
Fig. 6.
Fig. 6.
Multiparametric magnetic resonance imaging shows early regional reduction in cortical blood flow in a mouse model of ADPKD. (A) Experimental setup. At 9 months or 3 months of age, Pkd1+/+ and Pkd1RC/RC mice underwent T2-FLAIR magnetic resonance imaging (MRI) for structural imaging and arterial spin labelling (ASL) to assess renal blood flow (RBF), distinguishing cortical and medullary flow. Structural imaging enabled segmentation of cortex from medulla. Arrowheads indicate cysts. Scale bar: 2 mm. (B,C) ASL heatmaps of RBF at 9 months (B) and 3 months (C) show reduced cortical flow in Pkd1RC/RC kidneys compared to Pkd1+/+ kidneys. (D) Quantification of RBF at 9 months. One-way ANOVA showed significant differences, with reduced RBF in the cortex compared to medulla in wild-type kidneys (mean difference=426.1±31.1 ml/min/100 g, 95% c.i.=331.4-529.8, P<0.0001), and a reduction in the cortical RBF in Pkd1RC/RC compared to wild-type kidneys (mean difference=424.4±30.2 ml/min/100 g, 95% c.i.=337.9-510.0, P<0.0001). (E) Quantification of RBF at 3 months. Similar reductions in wild-type kidney RBF between medulla and cortex (mean difference=577.6±53.0 ml/min/100 g, 95% c.i.=428.6-726.6, P<0.0001), and between the cortex of Pkd1RC/RC compared to wild-type kidneys (mean difference=285.0±52.9 ml/min/100 g, 95% c.i.=136.1-434.0, P=0.0002), were observed (one-way ANOVA). (F) Quantification of RBF at 3 months, with macroscopic cysts segmented out of Pkd1RC/RC mouse kidneys. The reduction in cortical RBF was maintained in the Pkd1RC/RC kidney cortex using this approach (mean difference in 259.6±66.4 ml/min/100 g, 95% c.i.=109.5-409.7, P=0.0035; unpaired two-tailed Student's t-test). Each data point in D-F represents a kidney measured from an individual mouse, with cortex represented by red points and medulla by green points. **P<0.0021, ***P<0.0002, ****P<0.0001.

References

    1. Agterberg, F. P. (2013). Fractals and spatial statistics of point patterns. J. Earth Sci. 24, 1-11. 10.1007/s12583-013-0305-6 - DOI
    1. Arroyo, J., Escobar-Zarate, D., Wells, H. H., Constans, M. M., Thao, K., Smith, J. M., Sieben, C. J., Martell, M. R., Kline, T. L., Irazabal, M. V.et al. (2021). The genetic background significantly impacts the severity of kidney cystic disease in the Pkd1RC/RC mouse model of autosomal dominant polycystic kidney disease. Kidney Int. 99, 1392-1407. 10.1016/j.kint.2021.01.028 - DOI - PMC - PubMed
    1. Barry, D. M., McMillan, E. A., Kunar, B., Lis, R., Zhang, T., Lu, T., Daniel, E., Yokoyama, M., Gomez-Salinero, J. M., Sureshbabu, A.et al. (2019). Molecular determinants of nephron vascular specialization in the kidney. Nat. Commun. 10, 5705. 10.1038/s41467-019-12872-5 - DOI - PMC - PubMed
    1. Bell, S. E., Sanchez, M. J., Spasic-Boskovic, O., Santalucia, T., Gambardella, L., Burton, G. J., Murphy, J. J., Norton, J. D., Clark, A. R. and Turner, M. (2006). The RNA binding protein Zfp36l1 is required for normal vascularisation and post-transcriptionally regulates VEGF expression. Dev. Dyn. 235, 3144-3155. 10.1002/dvdy.20949 - DOI - PubMed
    1. Bello-Reuss, E., Holubec, K. and Rajaraman, S. (2001). Angiogenesis in autosomal-dominant polycystic kidney disease. Kidney Int. 60, 37-45. 10.1046/j.1523-1755.2001.00768.x - DOI - PubMed

Substances

LinkOut - more resources