. 2025 Mar 21:16:202-218.
doi: 10.18632/oncotarget.28705.

FGR Src family kinase causes signaling and phenotypic shift mimicking retinoic acid-induced differentiation of leukemic cells

Affiliations

FGR Src family kinase causes signaling and phenotypic shift mimicking retinoic acid-induced differentiation of leukemic cells

Noor Kazim et al. Oncotarget. .

Abstract

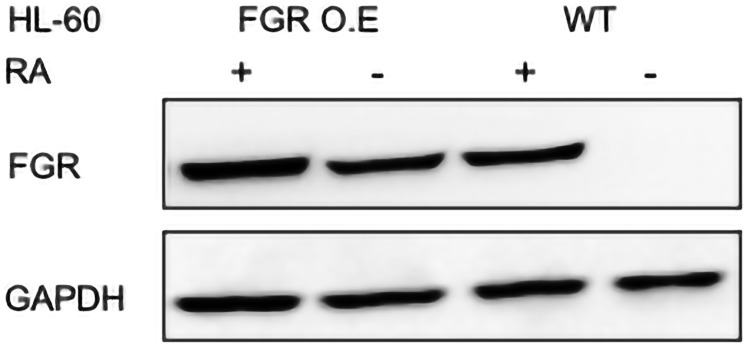
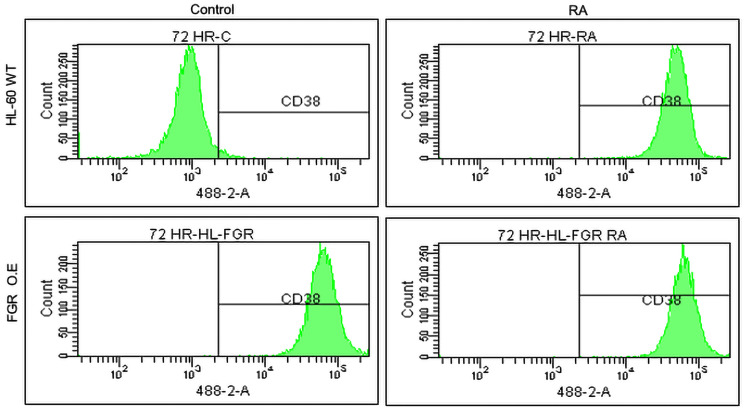
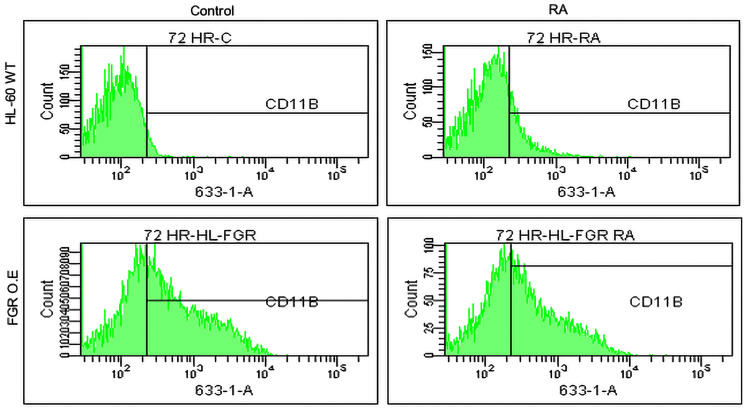
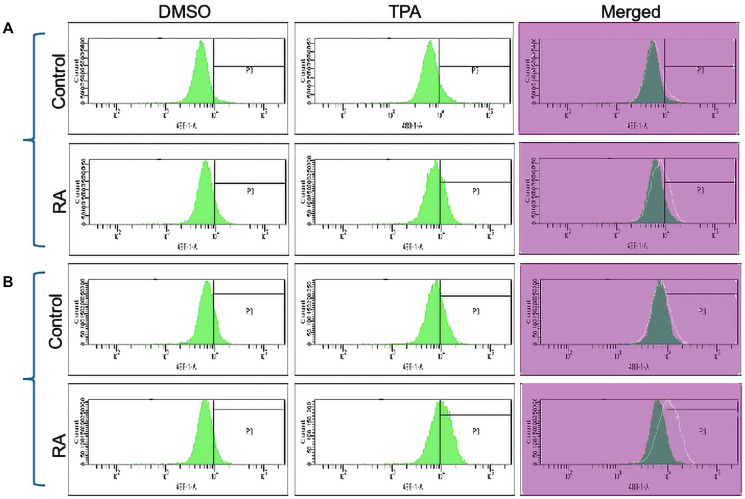
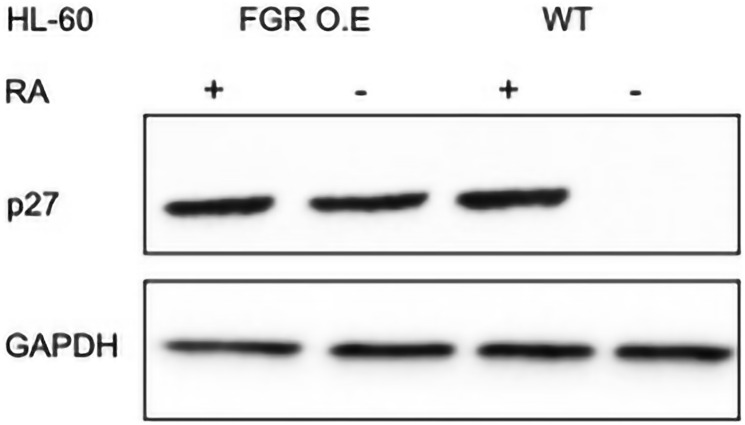
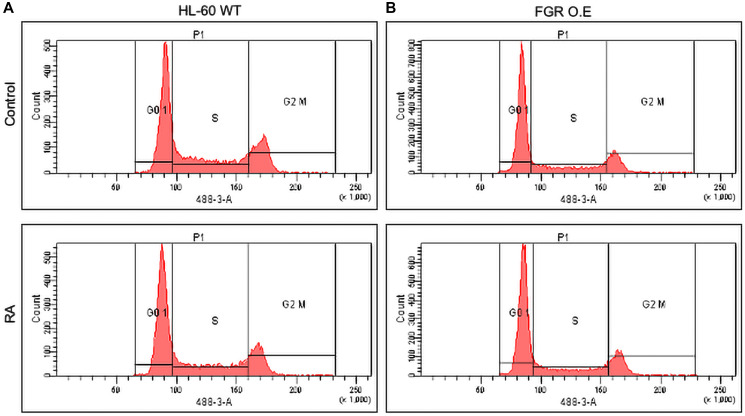
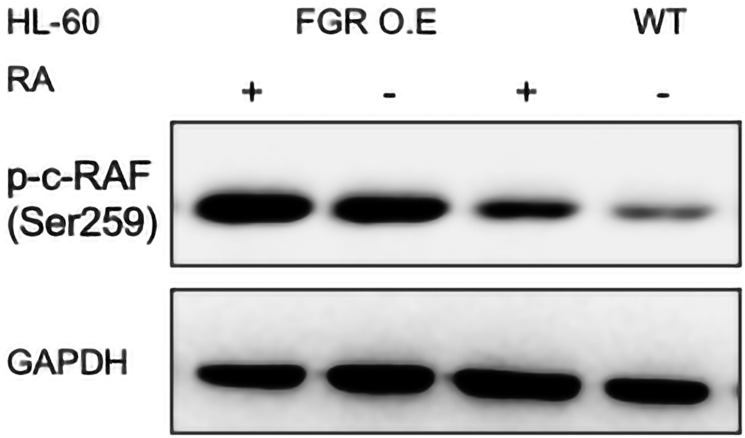
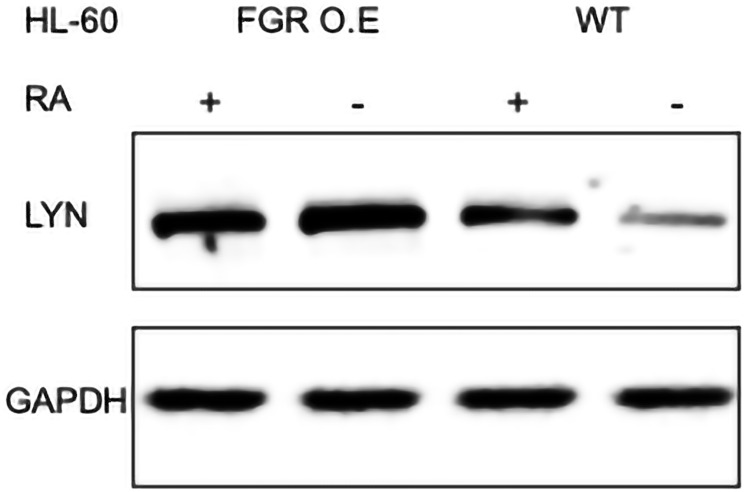
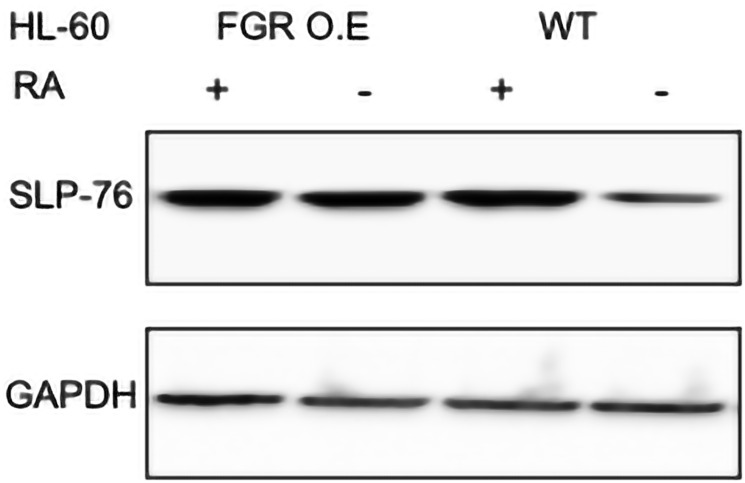
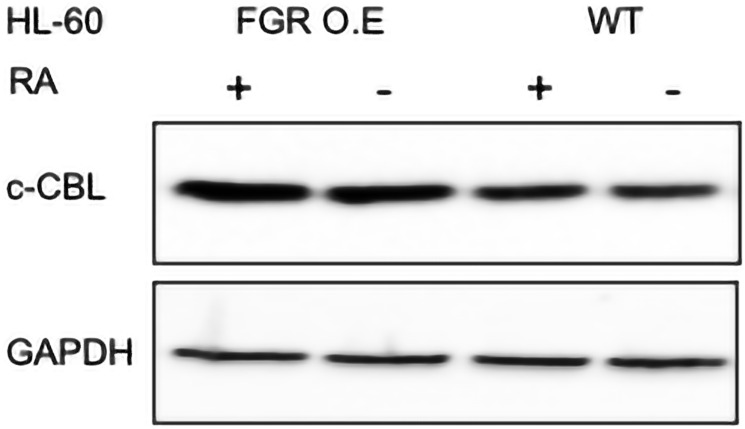
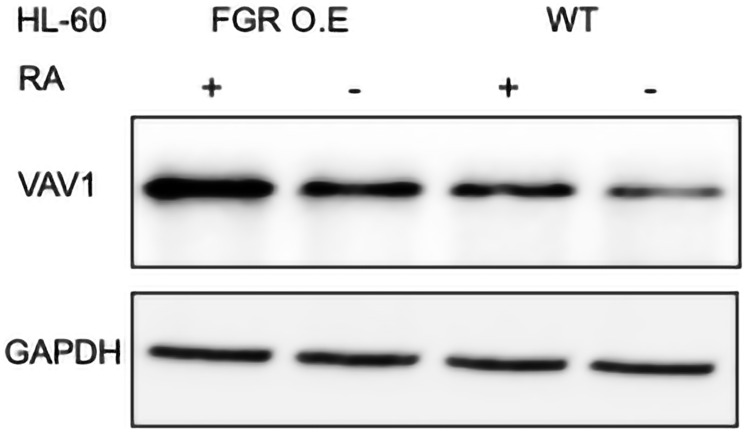
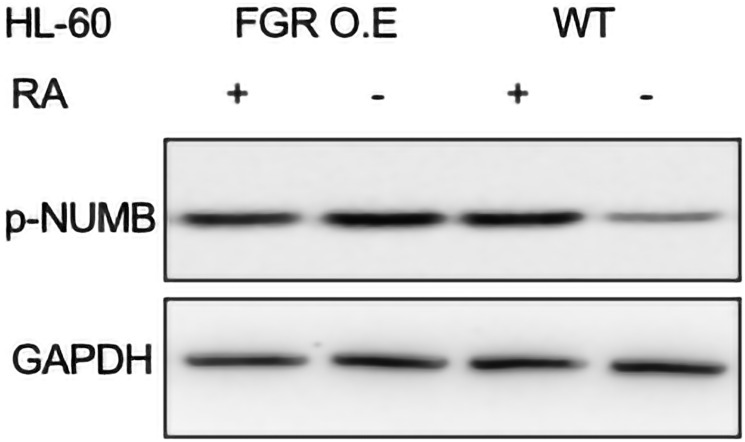
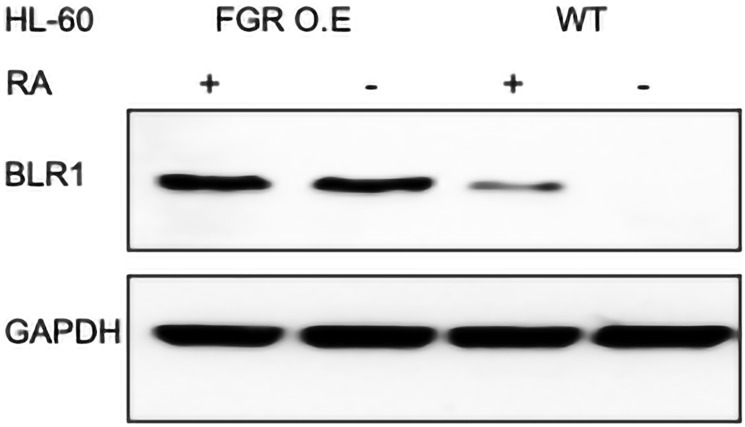
Retinoic acid (RA), an embryonic morphogen, is used in cancer differentiation therapy, causing extensive gene expression changes leading to cell differentiation. This study reveals that the expression of the Src-family kinase (SFK), FGR, alone can induce cell differentiation similar to RA. Traditionally, RA's mechanism involves transcriptional activation via RAR/RXR(Retinoic Acid Receptor/Retinoid X Receptor) nuclear receptors. In the HL-60 human myelo-monocytic leukemia model, an actively proliferating phenotypically immature, lineage bipotent NCI-60 cell line. RA promotes myeloid lineage selection and maturation with G1/0 growth inhibition. This study finds that FGR expression alone is sufficient to induce differentiation, marked by CD38, CD11b, ROS, and p27(kip1) expression, characteristic of mature myeloid cells. To understand the mechanism, signaling attributes promoting RA-induced differentiation were analyzed. RA induces FGR expression, which activates a novel cytosolic macromolecular signaling complex(signalsome) driving differentiation. RA increases the abundance, associations, and phosphorylation of signalsome components, including RAF, LYN, FGR, SLP-76, and CBL, which appear as nodes in the signalsome. These traditionally cytosolic signaling molecules go into the nucleus. RAF complexes with a retinoic acid-response element (RARE) in the blr1 gene promoter, where the induced BLR1 expression is essential for RA-induced differentiation. We find now that FGR expression mimics RA's enhancement of signalsome nodes, RAF expression, and phosphorylation, leading to BLR1 expression. Notably, FGR induces the expression of genes targeted by RAR/RXR, such as cd38 and blr1, even without RA. Thus, FGR triggers signaling events and phenotypic shifts characteristic of RA. This finding represents a paradigm shift, given FGR's historical role as a pro-proliferation oncogene.

Keywords: FGR Src-family-kinase; cancer biology and cell cycle regulation; cancer differentiation-therapy; leukemia; retinoic acid(RA).


Conflict of interest statement

CONFLICTS OF INTEREST

Authors have no conflicts of interest to declare.

Figures

Figure 1
Figure 1. FGR Western blot analysis of HL-60 wt and FGR O.E cells untreated and treated with RA.
Wild-type and FGR O.E HL-60 cells were untreated (control) or treated for 72 h with RA (1 μM) as indicated. 25 μg of lysate per lane was resolved by SDS PAGE and electro-transferred to membranes. Membrane images for each protein are cropped to show only the band of interest. For all Western blots, densitometric analysis of 3 or more biological repeats were quantified using ImageJ and shown in Supplementary Figure 10.
Figure 2
Figure 2. Phenotypic cell surface differentiation marker analysis of HL-60 wt and FGR O.E cells untreated and treated with RA.
HL-60 cells were cultured in the absence (control) or presence of 1 μM RA as indicated. CD38 expression was assessed by flow cytometry following 72 h treatment period. Gating to discriminate positive cells was set to exclude 95% of untreated controls. Quantification of 3 or more biological repeats is in Supplementary Figure 19.
Figure 3
Figure 3. Phenotypic cell surface differentiation marker analysis of HL-60 wt and FGR O.E cells untreated and treated with RA.
CD11b expression was assessed by flow cytometry after 72 h treatment periods. Gating to discriminate positive cells was 95% of untreated controls. Quantification of 3 or more biological repeats is in Supplementary Figure 20.
Figure 4
Figure 4. Functional differentiation marker analysis of HL-60 wt and FGR O.E cells untreated and treated with RA measured by TPA-induced respiratory burst.
(A) HL-60 WT (parental wildtype) cells were cultured in the absence (control) or presence of 1 μM RA as indicated. (B) FGR O.E cells were cultured in the absence or presence of 1 μM RA as indicated. Respiratory burst was analyzed by measuring reactive oxygen species (ROS) production by flow cytometry using the 2′,7′-dichlorofluorescein (DCF) assay for DMSO carrier control and TPA induced cells. Gates shown in the histograms were set to exclude 95% of the DMSO-treated control population (carrier control) for each culture condition. For each of the 4 cases, WT and FGR that were control and RA-treated, TPA-treated samples show induced ROS. Inducible ROS production is betrayed by the shift in the TPA histogram compared to the DMSO histogram shown in the merged histogram. Quantification of 3 or more biological repeats is in Supplementary Figure 21.
Figure 5
Figure 5. p27 Western blot analysis of HL-60 wt and FGR O.E cells untreated and treated with RA.
Wild-type and FGR O.E HL-60 cells were untreated (control) or treated for 72 h with RA (1 μM) as indicated. 25 μg of lysate per lane was resolved by SDS PAGE and electro-transferred to membranes. Membrane images for each protein are cropped to show only the band of interest. For all Western blots, densitometric analysis of 3 or more biological repeats were quantified using ImageJ and shown in Supplementary Figure 11.
Figure 6
Figure 6. Cell cycle analysis of HL-60 WT and FGR O.E cells.
DNA histograms show FGR transfectants were enriched for relative number of G1/0 cells compared to the wt cells. Wild-type and FGR O.E cell lines were cultured for 72 h without (untreated control) or with 1 μM RA as indicated. Cell cycle distribution showing the percentage of cells in G1/G0 was analyzed using flow cytometry with propidium iodide staining at 72 h. Gates define the G1, S, and G2/M subpopulations (left to right). G1/0 arrest is indicated by an increase in the G1 peak for FGR O.E compared to wt cells. Quantification of 3 or more biological repeats is in Supplementary Figure 22.
Figure 7
Figure 7. p-c-RAF (Ser259) Western blot analysis of HL-60 wt and FGR O.E cells untreated and treated with RA.
Wild-type and Fgr O.E HL-60 cells were untreated (control) or treated for 72 h with RA (1 μM) as indicated. 25 μg of lysate per lane was resolved by SDS PAGE and electro- transferred to membranes. Membrane images for each protein are cropped to show only the band of interest. For all Western blots, densitometric analysis of 3 or more biological repeats were quantified using ImageJ and shown in Supplementary Figure 12.
Figure 8
Figure 8. LYN Western blot analysis of HL-60 wt and FGR O.E cells untreated and treated with RA.
Wild-type and Fgr O.E HL-60 cells were untreated (control) or treated for 72 h with RA (1 μM) as indicated. 25 μg of lysate per lane was resolved by SDS PAGE and electro-transferred to membranes. Membrane images for each protein are cropped to show only the band of interest. For all Western blots, densitometric analysis of 3 or more biological repeats were quantified using ImageJ and shown in Supplementary Figure 13.
Figure 9
Figure 9. SLP-76 Western blot analysis of HL-60 wt and FGR O.E cells untreated and treated with RA.
Wild-type and Fgr O.E HL-60 cells were untreated (control) or treated for 72 h with RA (1 μM) as indicated. 25 μg of lysate per lane was resolved by SDS PAGE and electro-transferred to membranes. Membrane images for each protein are cropped to show only the band of interest. For all Western blots, densitometric analysis of 3 or more biological repeats were quantified using ImageJ and shown in Supplementary Figure 14.
Figure 10
Figure 10. c-CBL Western blot analysis of HL-60 wt and FGR O.E cells untreated and treated with RA.
Wild-type and Fgr O.E HL-60 cells were untreated (control) or treated for 72 h with RA (1 μM) as indicated. 25 μg of lysate per lane was resolved by SDS PAGE and electro- transferred to membranes. Membrane images for each protein are cropped to show only the band of interest. For all Western blots, densitometric analysis of 3 or more biological repeats were quantified using ImageJ and shown in Supplementary Figure 15.
Figure 11
Figure 11. VAV1 Western blot analysis of HL-60 wt and FGR O.E cells untreated and treated with RA.
Wild-type and Fgr O.E HL-60 cells were untreated (control) or treated for 72 h with RA (1 μM) as indicated. 25 μg of lysate per lane was resolved by SDS PAGE and electro-transferred to membranes. Membrane images for each protein are cropped to show only the band of interest. For all Western blots, densitometric analysis of 3 or more biological repeats were quantified using ImageJ and shown in Supplementary Figure 16.
Figure 12
Figure 12. p-NUMB Western blot analysis of HL-60 wt and FGR O.E cells untreated and treated with RA.
Wild-type and Fgr O.E HL-60 cells were untreated (control) or treated for 72 h with RA (1 μM) as indicated. 25 μg of lysate per lane was resolved by SDS PAGE and electro- transferred to membranes. Membrane images for each protein are cropped to show only the band of interest. For all Western blots, densitometric analysis of 3 or more biological repeats were quantified using ImageJ and shown in Supplementary Figure 17.
Figure 13
Figure 13. BLR1 Western blot analysis of HL-60 wt and FGR O.E cells untreated and treated with RA.
Wild-type and Fgr O.E HL-60 cells were untreated (control) or treated for 72 h with RA (1 μM) as indicated. 25 μg of lysate per lane was resolved by SDS PAGE and electro-transferred to membranes. Membrane images for each protein are cropped to show only the band of interest. For all Western blots, densitometric analysis of 3 or more biological repeats were quantified using ImageJ and shown in Supplementary Figure 18.

Similar articles

Cited by

References

    1. Rhinn M, Dollé P. Retinoic acid signalling during development. Development. 2012; 139:843–58. 10.1242/dev.065938. - DOI - PubMed
    1. Giguère V. Retinoic acid receptors and cellular retinoid binding proteins: complex interplay in retinoid signaling. Endocr Rev. 1994; 15:61–79. 10.1210/edrv-15-1-61. - DOI - PubMed
    1. Chen J, Ding Z. Natural products as potential drug treatments for acute promyelocytic leukemia. Chin Med. 2024; 19:57. 10.1186/s13020-024-00928-8. - DOI - PMC - PubMed
    1. Ghyselinck NB, Duester G. Retinoic acid signaling pathways. Development. 2019; 146:dev167502. 10.1242/dev.167502. - DOI - PMC - PubMed
    1. Breitman TR, Selonick SE, Collins SJ. Induction of differentiation of the human promyelocytic leukemia cell line (HL-60) by retinoic acid. Proc Natl Acad Sci U S A. 1980; 77:2936–40. 10.1073/pnas.77.5.2936. - DOI - PMC - PubMed

LinkOut - more resources