. 2025 Mar 21;20(3):e0319280.
doi: 10.1371/journal.pone.0319280. eCollection 2025.

Kinetic modelling reveals the presence of multistability in normal and stressful conditions in translational initiation mechanism

Affiliations

Kinetic modelling reveals the presence of multistability in normal and stressful conditions in translational initiation mechanism

Guturu L Harika et al. PLoS One. .

Abstract

Protein synthesis involves translation initiation, elongation, termination, and ribosome recycling, and each step is controlled intricately by many signaling proteins. Translation initiation can be compactly categorized into two mechanisms: primary and secondary. The primary mechanism involves the recruitment of three important eukaryotic initiation factors, eIF2-GDP, eIF5, and eIF2B, and their interactions, followed by the GDP-GTP exchange by eIF2B to form an active dimer eIF2-GTP. The dimer binds with Met-tRNA to form a robust ternary complex (TC). The secondary mechanism closely mirrors the primary reaction mechanism, except that the interactions of eIF2B and eIF5 happen with the TC to form complexes. These interactions happen with high fidelity and precision, failing which fail-safe mechanisms are invoked instantaneously to delay the initiation process. In this work, we build a mathematical model to unravel how the transition between translation initiation and termination occurs at the initiation stage based on the elementary mechanisms we built from the network assembled from experimental observations. We focus only on the dynamics of primary and secondary mechanisms involved in the translation initiation process under normal and integrated stress response (ISR) conditions that act as a fail-safe mechanism by through phosphorylation-dephosphorylation (PdP) reactions. Since the network is huge and has many unknown kinetic parameters, we perform structural analysis using chemical reaction network theory (CRNT) and find hidden positive feedback loops that regulate the initiation mechanism. We apply bifurcation theory to show that the model exhibits ultrasensitivity and bistability under normal conditions, while under ISR, it exhibits both bistability and tristability for the choice of kinetic parameters. We attribute bistability to translation initiation and termination and tristability in ISR to translation recovery and attenuation. We conclude that the translation initiation process is a highly regulated process guided by the threshold and switching mechanisms to make quick decisions on the translation initiation, termination, recovery or attenuation under different conditions.


Conflict of interest statement

The authors have declared that no competing interests exist.

Figures
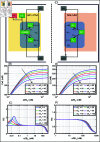
Fig 1
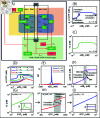
Fig 1. Module 1 (M1), primary mechanism (PM), and module 2 (M2), secondary mechanism (SM) under normal conditions (NC).
A: Network of e5 and e2B binding with e2GDP along with the competition and displacement reaction in PM. Along with the competition between e5 and e2B, we introduce an additional displacement reaction in which e2B displaces e5 from e2GDP. B: Bifurcation diagram of Ce2 with total e2B (e2BT) as the parameter with different concentrations of total e5 (e5T) ranging from 0 – 100 nM. C: The response coefficient (RC) plot of Ce2 with e2BT as the parameter. D: Network of e5 and e2B binding with TC along with the competition and displacement reaction in SM. Along with the competition between e5 and e2B, e5 displaces e2B from TC. E: Bifurcation diagram of C2 with total e2B (e2BT) as the parameter with different concentrations of total e5 (e5T) ranging from 0 – 100 nM. F: The response coefficient (RC) plot of C2 with e2BT as the parameter. The RC is given by d(ln(Ce2))d(ln(e2BT)). The XPPAUT files used for simulations is in the supplementary S7 Fig1A.ode, and S8 Fig1D.ode.
Fig 2
Fig 2. Module 1 (M1), primary mechanism (PM) and Module 2 (M2), secondary mechanism (SM), and Module 3 (M3) GDP-GTP exchange under normal conditions (NC).
A: Network of translation initiation under normal conditions. B: Bifurcation diagram of e2GTP with e2BT as parameter keeping e5T at 30 nM showing ultrasensitive and biphasic dynamics. C: Bifurcation diagram of TC with e2BT as parameter keeping e5T at 30 nM showing ultrasensitive and biphasic dynamics. D: Bifurcation diagram of e2GTP with total e2B (e2BT) as the parameter with different concentrations of total e5 (e5T) ranging from 30 – 500 nM. E: The response coefficient (RC) plot of e2GTP with e2BT as the parameter. The RC is given by d(ln(e2GTP))d(ln(e2BT)). The RC is shown only for the ultrasensitive plots. F: Bifurcation of e2GTP with e2BT as the parameter showing bistable dynamics. With the increase in e2BT concentration, the system switches from a lower steady state to a higher steady state, corresponding to termination and initiation of translation, respectively. The total concentrations of free e2, e5, tR, GTP, and GDP were kept constant at 500, 250, 2500, 1200 and 40 nM, respectively. G: Bifurcation diagram of TC with total GTP (GTPT) as parameter keeping the ratio of e5Te2BT=10 showing ultrasensitive dynamics. The RC plot in the inset shows ultrasensitivity. H: Bifurcation diagram of TC with GTPT as parameter keeping the ratio of e5Te2BT=50 showing bistable dynamics. I: Bifurcation diagram of TC with GTPT as parameter keeping the ratio of e5Te2BT=125 showing graded response. The inset’s RC plot shows a graded response. The XPPAUT file used for simulations is in the Supporting information S9 Fig2A.ode.
Fig 3
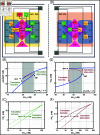
Fig 3. Module 1 (M1), the primary mechanism (PM), and Module 2 (M2), the secondary mechanism (SM) under normal (NC) and stressful (SC) conditions along with the phosphorylation and dephosphorylation reactions (PdP).
A: Primary mechanism of translation initiation under normal and stressful conditions. This network captures all the interactions involving e5 and e2B with e2 and the phosphorylation and dephosphorylation reactions. B: Bifurcation diagram of e2pGDP with total kinase (kinT) as the parameter. The level of kinT represents the amount of stress. With the increase in kinT concentration, the concentration of e2pGDP switches from lower to higher, which indicates translation attenuation. In this context, the two bistable states correspond to translation attenuation and recovery. The total concentrations of free e2, e2B, e5, PP, and GDP were kept constant at 55, 2, 35, 3, and 1260 nM, respectively. C: Stress-destress plane, kinT and PPT, are the two parameters used to show the attenuation and recovery of translation. The region within the green line represents the bistable region. The yellow dot represents the neutral state of the checkpoint. As the arrows point in the diagram, the checkpoint is engaged towards the right of the neutral checkpoint, and on the left, the checkpoint is disengaged. The activation and deactivation correspond to translation attenuation and recovery, respectively. D: Secondary mechanism of translation initiation under normal and stressful conditions. This network captures all the interactions involving e5 and e2B with TC and the phosphorylation and dephosphorylation reactions. E: Bifurcation diagram of TCp with total kinase (kinT) as the parameter. The two bistable states correspond to translation attenuation and recovery. The total concentrations of free TC, e2B, e5, and PP were kept constant at 50, 18, 40, and 4 nM, respectively. F: Stress-destress plane, kinT and PPT, are the two parameters used to show the attenuation and recovery of translation. The XPPAUT files used for simulations is in the Supporting information S10 Fig3A.ode, and S11 Fig3D.ode.
Fig 4
Fig 4. Network of integrated stress response.
This circuit gives an overview of integrated stress response in the translation process. The entire network is divided into three modules: module 1 (R1-R11): primary mechanism (M1: PM), module 2 (R15-R24): secondary mechanism (M2: SM), and module 3 (R12-R14): coupling of primary and secondary mechanism by GDP-GTP exchange (M3: GDP-GTP Exchange). The reactions in M1 and M2 are further grouped into normal conditions (NC), stressful conditions (SC) and phosphorylation-dephosphorylation reactions (PdP). The phosphorylated species are shown in yellow boxes, and the unphosphorylated species in green boxes where e2 is the short form of free eIF2, and TC is the short form of the ternary complex, which is a complex of e2GTP and Met-tRNA represented by tR shown in red box. Other species, kinase (kin), phosphatase (PP), GDP, and GTP are in red boxes. The eukaryotic initiation factors eIF5 (e5) and eIF2B (e2B) are given in grey boxes. All the reactions are based on mass action kinetic laws. The blue lines represent the phosphorylation and dephosphorylation reactions. Also, the red lines are for GDP-GTP exchange and ternary complex formation. The NET file for the circuit is given in the Supporting information S6 Fig4.NET.
Fig 5
Fig 5. Effect of GTP on bistable dynamics for a constant e5Te2BT under ISR.
A: Bifurcation diagram of e2pGDP with total kinase (kinT) as the parameter. We keep the total GTP (GTPT) at 150 nM. The inset contains the response coefficient (RC) graph. The RC graph shows a graded response. The bifurcation shows bistability. B: Bifurcation diagram of e2pGDP with kinT as the parameter. We keep GTPT at 400 nM. The inset contains the RC graph to show the presence of ultrasensitivity. The bifurcation shows bistability is followed by ultrasensitivity. C: Bifurcation diagram of e2pGDP with kinT as the parameter. We keep GTPT at 1500 nM. The bifurcation shows tristability. The first jump shown in green arrows is attributed to the translation attenuation and recovery by the primary mechanism (PM). The second jump shown in red arrows is attributed to the translation attenuation and recovery by the secondary mechanism (SM). D: Bifurcation diagram of TCp with kinT as the parameter. We keep GTPT at 150 nM. E: Bifurcation diagram of TCp with kinT as the parameter. We keep GTPT at 400 nM. F: Bifurcation diagram of TCp with kinT as the parameter. We keep GTPT at 1500 nM. The bifurcation shows tristability. We keep e5Te2BT=1.9. The XPPAUT file used for simulations is in the Supporting information S12 Fig4.ode.
Fig 6
Fig 6. Bifurcation diagram and stress-destress plane using ISR network.
Bifurcation diagram of e2pGDP with total kinase (kinT) as the parameter. The first jump, shown by the green arrows, represents translation attenuation and recovery by the PM. The second jump, shown by the red arrows, represents the translation attenuation and recovery by the SM. With the increase in kinT concentration, the concentration of e2pGDP switches from a lower to a higher state in two jumps. However, when kinT decreases with the decrease in stress, the system switches to the lowest state in one jump to start the translation process immediately. The insets show the stress-destress plane, kinT and PPT are the two parameters used to show the translation attenuation and recovery by PM and SM. The region within the green line represents the first jump corresponding to the PM. The region within the red line represents the second jump corresponding to the SM. The yellow dot represents the neutral state of the checkpoint. As the arrows point in the diagram, the checkpoint is engaged towards the right of the neutral checkpoint, and on the left, the checkpoint is disengaged. The translation attenuation and recovery happen in two stages: PM (green arrows) and SM (red arrows). The total concentrations of free e2, e2B, e5, PP, GTP, GDP, and tR were kept constant at 310, 53, 100, 24, 1500, 1510, and 310 nM, respectively. The XPPAUT file used for simulations is in the Supporting information S12 Fig4.ode.
Fig 7
Fig 7. Bifurcation of e2pGDP at different ratios of e5Te2BT.
A: Bifurcation diagram of e2pGDP using the primary mechanism (PM) alone, with total kinase (kinT). We keep e5Te2BT=1. B: Bifurcation diagram of e2pGDP using PM alone with kinT as the parameter showing bistability. We keep e5Te2BT=17.5. The jump is attributed to the translation attenuation and recovery C: Bifurcation diagram of e2pGDP using PM alone with kinT. We keep e5Te2BT=32.5. D: Bifurcation diagram of e2pGDP using both PM and secondary mechanism (SM) with kinT as the parameter showing bistability. We keep e5Te2BT=0.47. E: Bifurcation diagram of e2pGDP with kinT as the parameter showing tristability. We keep e5Te2BT=1.9. The first jump shown in green arrows is attributed to the translation attenuation and recovery by the PM. The second jump shown in red arrows is attributed to the translation attenuation and recovery by the SM. F: Bifurcation diagram of e2pGDP using both PM and SM with kinT as the parameter showing bistability. We keep e5Te2BT=3.2. In all the figures, we keep the total GTP (GTPT) at 1500 nM. The XPPAUT files used for simulations are in the Supporting information S10 Fig3A.ode and S12 Fig4.ode.

References

    1. Costa-Mattioli M, Walter P. The integrated stress response: From mechanism to disease. Science. 2020;368(6489). doi: 10.1126/science.aat5314 - DOI - PMC - PubMed
    1. Jennings MD, Kershaw CJ, Adomavicius T, Pavitt GD. Fail-safe control of translation initiation by dissociation of eIF2α phosphorylated ternary complexes. eLife. 2017;6. doi: 10.7554/eLife.24542 - DOI - PMC - PubMed
    1. Jennings MD, Zhou Y, Mohammad-Qureshi SS, Bennett D, Pavitt GD. eIF2B promotes eIF5 dissociation from eIF2•GDP to facilitate guanine nucleotide exchange for translation initiation. Genes Dev 2013;27(24):2696–707. doi: 10.1101/gad.231514.113 - DOI - PMC - PubMed
    1. Jennings MD, Pavitt GD. eIF5 is a dual function GAP and GDI for eukaryotic translational control. Small GTPases 2010;1(2):118–23. doi: 10.4161/sgtp.1.2.13783 - DOI - PMC - PubMed
    1. Algire MA, Maag D, Savio P, Acker MG, Tarun SZ Jr, Sachs AB, et al.. Development and characterization of a reconstituted yeast translation initiation system. RNA 2002;8(3):382–97. doi: 10.1017/s1355838202029527 - DOI - PMC - PubMed

LinkOut - more resources