. 2025 Apr:114:105653.
doi: 10.1016/j.ebiom.2025.105653. Epub 2025 Mar 20.

Chromatin landscape in paired human visceral and subcutaneous adipose tissue and its impact on clinical variables in obesity

Affiliations

Chromatin landscape in paired human visceral and subcutaneous adipose tissue and its impact on clinical variables in obesity

Sadia Saeed et al. EBioMedicine. 2025 Apr.

Abstract

Background: Obesity is a global health challenge and adipose tissue exhibits distinct depot-specific characteristics impacting differentially on the risk of metabolic comorbidities.

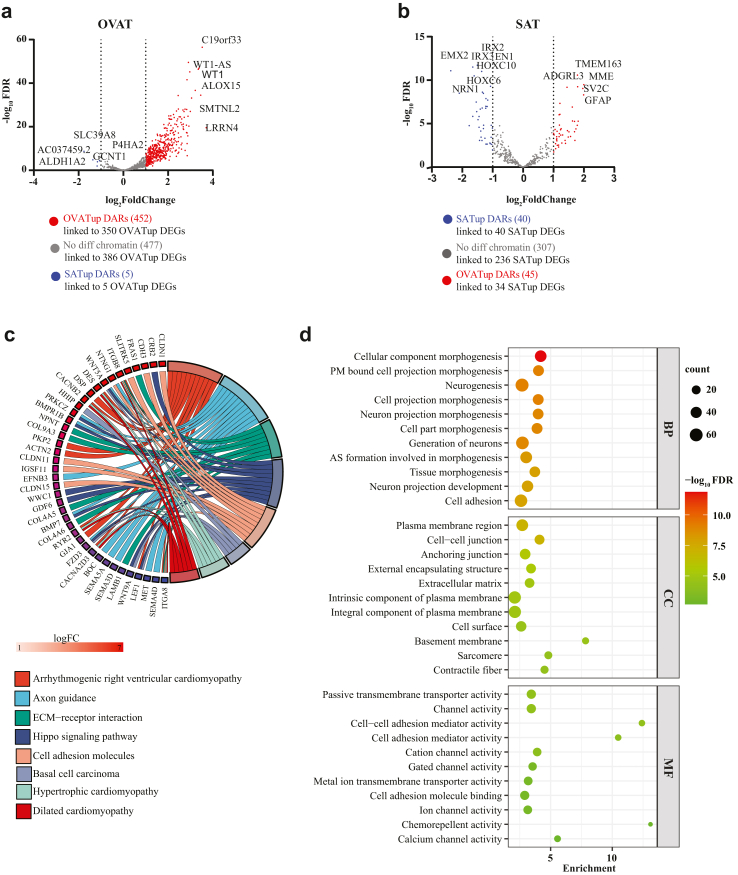
Methods: Here, we integrate chromatin accessibility (ATAC-seq) and gene expression (RNA-seq) data from intra-individually paired human subcutaneous (SAT) and omental visceral adipose tissue (OVAT) samples to unveil depot-specific regulatory mechanisms.

Findings: We identified twice as many depot-specific differentially accessible regions (DARs) in OVAT compared to SAT. SAT-specific regions showed enrichment for adipose tissue enhancers involving genes controlling extracellular matrix organization and metabolic processes. In contrast, OVAT-specific regions showed enrichment in promoters linked to genes associated with cardiomyopathies. Moreover, OVAT-specific regions were enriched for bivalent transcription start site and repressive chromatin states, suggesting a "lingering" regulatory state. Motif analysis identified CTCF and BACH1 as most significantly enriched motifs in SAT and OVAT-specific DARs, respectively. Distinct gene sets correlated with important clinical variables of obesity, fat distribution measures, as well as insulin, glucose, and lipid metabolism.

Interpretation: We provide an integrated analysis of chromatin accessibility and transcriptional profiles in paired human SAT and OVAT samples, offering new insights into the regulatory landscape of adipose tissue and highlighting depot-specific mechanisms in obesity pathogenesis.

Funding: SS received EU-Scientia postdoctoral Fellowship and project funding from the European Union's Horizon 2020 Research and Innovation program under the Marie Skłodowska-Curie Grant, (agreement No. 801133). LlCP and TR were supported by Helse Sør-Øst grants to Y.B (ID 2017079, ID 278908). MB received funding from grants from the DFG (German Research Foundation)-Projekt number 209933838-SFB 1052 (project B1) and by Deutsches Zentrum für Diabetesforschung (DZD, Grant: 82DZD00601).

Keywords: Adipose tissue; Chromatin accessibility; Gene expression; Obesity.


Conflict of interest statement

Declaration of interests MB received personal honoraria from Amgen, AstraZeneca, Bayer, Boehringer-Ingelheim, Lilly, Novo Nordisk, Novartis, and Sanofi as well as payments from Boehringer-Ingelheim to the institution. The other authors on the manuscript declared no competing interests.

Figures

Fig. 1
Fig. 1
Chromatin accessibility mapping (ATAC-seq) in intra-individually paired SAT and OVAT samples from patient’s with obesity. a) Principal component analysis performed on read counts from all SAT and OVAT samples. b) Genomic distribution of ATAC-seq called accessibility peaks in all SAT (P1s-P8s) and OVAT (P1v-P8v) samples. c and d) IGV browser view of the ATAC-seq signals of two different exemplary regions in all the subcutaneous (blue) and visceral (red) adipose tissue samples. Abbreviations: SAT = subcutaneous adipose tissue, OVAT = omental visceral adipose tissue.
Fig. 2
Fig. 2
Differentially Accessible Regions (DARs), overlap with roadmap adipose nuclei chromatin states. a) Volcano plot of differential chromatin accessibility between SAT and OVAT depots. Points highlighted in red and blue show OVAT and SAT specific differential accessibility respectively (as defined by log2(Fold Change) > 1 and FDR adjusted p-value < 0.05). b) Genomic distribution of SAT and OVAT specific differentially accessible regions across all ATAC-seq mapped samples. c) Annotation and enrichment the differentially accessible regions between SAT(blue) and OVAT (red) with respect to roadmap adipose nuclei chromatin states (E063). Barplot represents -log10 enrichment or depletion p-values, and number of actual overlapping counts, for each state (Fisher’s exact test, two-sided). d) Histone marks enrichment (ChIP-seq signals from Roadmap subcutaneous Adipose tissue) around SATup DARs.
Fig. 3
Fig. 3
Motif enrichment analysis in differentially accessible regions. a and b) Dotplot of the significantly overrepresented motifs in DARs between SAT (left) and OVAT(right). The size of the circle indicates the percentage of DARs containing the motif, colour indicates the log Q-value. c and d) Hierarchical clustering trees of WikiPathways enrichment of c) SAT and d) OVAT specific transcription factors motifs. Hierarchical clustering tree summarizes the correlation among significant pathways listed in the Enrichment tab. Pathways with many shared genes are clustered together. Bigger dots indicate more significant p-values. Abbreviations: SAT = subcutaneous adipose tissue, OVAT = omental visceral adipose tissue.
Fig. 4
Fig. 4
Integration of the ATAC-seq and RNA seq data for promoter analysis. a) Volcano plot of all genes with higher gene expression in OVAT and overlapping with differentially accessible regions in OVAT (red) versus SAT (blue) or regions without differential accessibility (grey) in their promoter region (defined as ±1 kb of their TSS). b) Volcano plot of all the genes with higher gene expression in SAT and overlapping with differentially accessible regions in SAT (blue) versus OVAT (RED) or regions without differential accessibility (grey) in their promoter region (defined as ±1 kb of their TSS). c) Circos plot of the KEGG pathway analysis for the OVATup DEGs having an OVATup DAR in their promoter region (from panel a (red) of the Fig. 4). d) Bubble plot showing the top Gene Ontology (GO) terms biological processes (BP), cellular component (CC) and molecular function (MF) significantly enriched in OVATup DEGs having an OVATup DAR in their promoter region (from panel a (red) of the Fig. 4). Size of the bubble represents the gene count whereas the colour represents the -log10FDR. Abbreviations: OVATup DAR = differentially accessible regions more open in omental visceral adipose tissue, OVATup DEG = differentially expressed genes upregulated in omental visceral adipose tissue; SATup DAR = differentially accessible regions more open in subcutaneous adipose tissue; SATup DEG = differentially expressed genes upregulated in subcutaneous adipose tissue.
Fig. 5
Fig. 5
Super Enhancer Analysis; Overlap of regions more open in SAT with adipose tissue Super Enhancers (SEs). a) IGV browser view of the two representative regions harbouring LAMB3 and TBX15 genes and having a chromatin region more open in SAT overlapping with an adipose nuclei super enhancer with differentially expressed gene in close vicinity. b) Circos plot of the KEGG pathway analysis for upregulated genes in SAT that are associated with more open chromatin regions and overlap with a super enhancer. c) Bubble plot showing the most relevant Gene Ontology (GO) terms biological processes (BP), cellular component (CC) and molecular function (MF) significantly enriched among upregulated genes in SAT that are associated with more open chromatin regions and overlap with a super enhancer (97). Size of the bubble represents the gene count whereas the colour represents the -log10FDR. d) Barplot showing Enricher based analysis of genes upregulated in SAT in regions that are more open in SAT and fall under the control of a super enhancer (97). Right bars panel shows selected enriched terms (for the input gene set “N = 97”) from Disease Gene association (DisGeNET) gene set library. Left bars panel shows top enriched terms (for the input gene set “N = 97”) from GWAS catalogue gene set library which contains variants associated with different human diseases traits. The enriched terms are displayed as -log10FDR values.
Fig. 6
Fig. 6
Correlation analysis of gene expression with clinical variables. a) Heatmap of the correlation of expression values (TPMs) in SAT with clinical variables. Correlation coefficient (r) values are indicated for the significant correlations and colour represents positive or negative correlation; significance level cutoff is set at p-value < 0.05. Genes included in this analysis are the ones upregulated in SAT, in regions more accessible in SAT and under control of a super enhancer) (N = 97) Abbreviation: TPM = transcript per million. b) Heatmap of the correlation of expression values (TPMs) of upregulated genes in OVAT with clinical variables. Correlation coefficient (r) values are indicated for the significant correlations and colour represents positive or negative correlation; significance level cutoff is set at p-value < 0.05. Genes included in this analysis are the ones upregulated in OVAT, and their promoter regions overlap with chromatin regions being more open in OVAT (N = 350) (promoter region defined as ±1 kb of their TSS) Abbreviation: TPM = transcript per million.

References

    1. Bluher M. Obesity: global epidemiology and pathogenesis. Nat Rev Endocrinol. 2019;15(5):288–298. - PubMed
    1. Bjorntorp P. Metabolic implications of body fat distribution. Diabetes Care. 1991;14(12):1132–1143. - PubMed
    1. Kissebah A.H., Krakower G.R. Regional adiposity and morbidity. Physiol Rev. 1994;74(4):761–811. - PubMed
    1. Snijder M.B., Visser M., Dekker J.M., et al. Low subcutaneous thigh fat is a risk factor for unfavourable glucose and lipid levels, independently of high abdominal fat. Health ABC Study Diabetol. 2005;48(2):301–308. - PubMed
    1. Tran T.T., Yamamoto Y., Gesta S., Kahn C.R. Beneficial effects of subcutaneous fat transplantation on metabolism. Cell Metab. 2008;7(5):410–420. - PMC - PubMed