Meta-Analysis
. 2025 Apr 9;5(4):100810.
doi: 10.1016/j.xgen.2025.100810. Epub 2025 Mar 20.

Cross-ancestry analyses of Chinese and European populations reveal insights into the genetic architecture and disease implication of metabolites

Affiliations
Meta-Analysis

Cross-ancestry analyses of Chinese and European populations reveal insights into the genetic architecture and disease implication of metabolites

Chenhao Lin et al. Cell Genom. .

Abstract

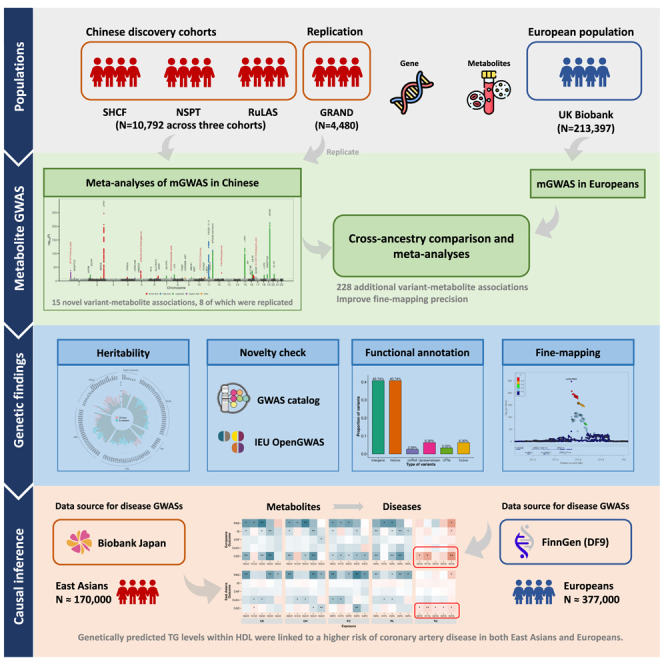
Differential susceptibilities to various diseases and corresponding metabolite variations have been documented across diverse ethnic populations, but the genetic determinants of these disparities remain unclear. Here, we performed large-scale genome-wide association studies of 171 directly quantifiable metabolites from a nuclear magnetic resonance-based metabolomics platform in 10,792 Han Chinese individuals. We identified 15 variant-metabolite associations, eight of which were successfully replicated in an independent Chinese population (n = 4,480). By cross-ancestry meta-analysis integrating 213,397 European individuals from the UK Biobank, we identified 228 additional variant-metabolite associations and improved fine-mapping precision. Moreover, two-sample Mendelian randomization analyses revealed evidence that genetically predicted levels of triglycerides in high-density lipoprotein were associated with a higher risk of coronary artery disease and that of glycine with a lower risk of heart failure in both ancestries. These findings enhance our understanding of the shared and specific genetic architecture of metabolites as well as their roles in complex diseases across populations.

Keywords: Mendelian randomization; cross-ancestry genetic studies; genetic determinants; metabolites.


Conflict of interest statement

Declaration of interests The authors declare no competing interests.

Figures

None
Graphical abstract
Figure 1
Figure 1
Study design and workflow In this study, we conducted meta-analyses of metabolite GWASs in 10,792 Chinese individuals and validated the findings in an independent external cohort of 4,480 Chinese individuals. Metabolite GWASs were also performed in 213,397 individuals of European ancestry from the UK Biobank, followed by cross-population comparisons and cross-ancestry meta-analyses. A two-sample MR approach was applied to infer causal relationships between metabolites and diseases in both East Asian and European populations.
Figure 2
Figure 2
Summary of genetic associations of metabolites in 10,792 Chinese participants (A) Summary information of metabolites included in the current study. VLDL, very-low-density lipoprotein; IDL, intermediate-density lipoprotein; LDL, low-density lipoprotein; HDL, high-density lipoprotein. (B) SNP-based heritability for each metabolite in 10,792 Chinese participants. The SNP-based heritability was calculated using the GREML method in GCTA tools. The height of the polar bar plot indicates the phenotypic variance of each metabolite explained by the SNP chip variants. The metabolites are marked with different colors based on metabolite classes. (C) Manhattan plot displaying chromosomal positions (x axis) of significant associations (p < 1.72 × 10−9). Colors indicate different metabolite classes. Putative causal genes with associations are highlighted in red. (D) Table of the eight lead associations identified in the discovery set (p < 1.72 × 10−9) and validated in the replication set (p < 0.003) of Chinese individuals. Chr, chromosome; EA, effect allele; NEA, non-effect allele; EAF, effect allele frequency; AF, allele frequency; MAF, minor allele frequency; mGWAS, metabolite genome-wide association study.
Figure 3
Figure 3
Genetic architecture of metabolite levels (A) Distribution of functional annotations of lead variants in the current study. Colors indicate different types of functional annotations. (B and C) Distribution of MAF (B) and effect size (C) based on the type of variants (nonsynonymous [red] versus synonymous or noncoding [blue]) identified in the present study. (D) Scatterplot of MAF versus effect size for independent associations, with variants colored by functional annotation.
Figure 4
Figure 4
Results of cross-ancestry GWAS meta-analysis of metabolites in Chinese participants (n = 15,272) and European participants (n = 213,397) (A) SNP-based heritability for each metabolite in Chinese cohorts and European individuals from the UK Biobank. (B) Comparison of the effect size and effect allele frequency for 833 lead variant-metabolite associations in Chinese and European populations. Associations with a variant of fold change in effect allele frequency larger than 5 are highlighted in blue, and those with a fold change in effect size larger than 5 are highlighted in orange. Associations with a fold change > 10 are explicitly labeled. (C) Manhattan plot of cross-ancestry meta-analyses. Colors indicate metabolite classes. Loci that harbored 228 additional associations that did not reach genome-wide significance threshold (p > 5 × 10−8) in original GWAS are highlighted in red. (D) Distribution of 95% credible set size (x axis) against the maximum posterior probability of variants in each locus (y axis). The blue triangles mark missense SNPs, with size proportional to correlated metabolite numbers. Association mapping into small (≤5 SNPs) credible sets with a high posterior probability (≥80%) is explicitly labeled.
Figure 5
Figure 5
Colocalization of metabolite-related loci with complex disease (A) Overview of the colocalization analyses between metabolites and different diseases. Red dots represent PPH4 > 0.8, and gray dots represent PPH4 between 0.6 and 0.8. (B) Distribution of colocalization signals between different metabolite-related loci and diseases. The bars are color coded to represent different disease categories. (C) Colocalization of H4TG and CAD in the APOE locus. (D) Colocalization of V0PN and asthma in the APOA5 locus. The color of the dots represents the degree of LD.
Figure 6
Figure 6
Results of two-sample MR analyses (A) Overview of 144 potential causal associations between circulating metabolites (top) and diseases (bottom) in East Asian individuals. ORs greater than 1 are shown in red, while those less than 1 are depicted in blue. CAD, coronary artery disease; COPD, chronic obstructive pulmonary disease; PAD, peripheral artery disease; T2D, type 2 diabetes. (B) The associations of genetically increased triglycerides in HDL with risk of cardiovascular disease in East Asian (bottom) and European (top) individuals. ∗∗p < 1.57 × 10−4, ∗p < 0.05). CE, cholesterol ester; CH, cholesterol; FC, free cholesterol; PL, phospholipid; TG, triglyceride; IS, ischemic stroke; CHF, congestive heart failure; CeAn, cerebral aneurysm. (C) The associations of genetically predicted higher levels of lipids with risk of COPD in East Asian (bottom) and European (top) individuals. (D) The associations of genetically predicted higher levels of glycine with risk of CAD and CHF in East Asian (left) and European (right) individuals. (E–G) MR results of (E) NAG1 on risk of asthma, (F) sarcosine on CAD, and (G) sarcosine on asthma.

References

    1. Nicholson G., Rantalainen M., Maher A.D., Li J.V., Malmodin D., Ahmadi K.R., Faber J.H., Hallgrímsdóttir I.B., Barrett A., Toft H., et al. Human metabolic profiles are stably controlled by genetic and environmental variation. Mol. Syst. Biol. 2011;7:525. doi: 10.1038/msb.2011.57. - DOI - PMC - PubMed
    1. Suhre K., Gieger C. Genetic variation in metabolic phenotypes: study designs and applications. Nat. Rev. Genet. 2012;13:759–769. doi: 10.1038/nrg3314. - DOI - PubMed
    1. Suhre K., Shin S.Y., Petersen A.K., Mohney R.P., Meredith D., Wägele B., Altmaier E., Deloukas P., Erdmann J., et al. CARDIoGRAM Human metabolic individuality in biomedical and pharmaceutical research. Nature. 2011;477:54–60. doi: 10.1038/nature10354. - DOI - PMC - PubMed
    1. Kettunen J., Tukiainen T., Sarin A.P., Ortega-Alonso A., Tikkanen E., Lyytikäinen L.P., Kangas A.J., Soininen P., Würtz P., Silander K., et al. Genome-wide association study identifies multiple loci influencing human serum metabolite levels. Nat. Genet. 2012;44:269–276. doi: 10.1038/ng.1073. - DOI - PMC - PubMed
    1. Rhee E.P., Ho J.E., Chen M.H., Shen D., Cheng S., Larson M.G., Ghorbani A., Shi X., Helenius I.T., O'Donnell C.J., et al. A genome-wide association study of the human metabolome in a community-based cohort. Cell Metab. 2013;18:130–143. doi: 10.1016/j.cmet.2013.06.013. - DOI - PMC - PubMed

Publication types

Supplementary concepts