. 2025 May:215:107707.
doi: 10.1016/j.phrs.2025.107707. Epub 2025 Mar 19.

Cleavage of the TrkB-FL receptor during epileptogenesis: insights from a kainic acid-induced model of epilepsy and human samples

Affiliations

Cleavage of the TrkB-FL receptor during epileptogenesis: insights from a kainic acid-induced model of epilepsy and human samples

Leonor Ribeiro-Rodrigues et al. Pharmacol Res. 2025 May.

Abstract

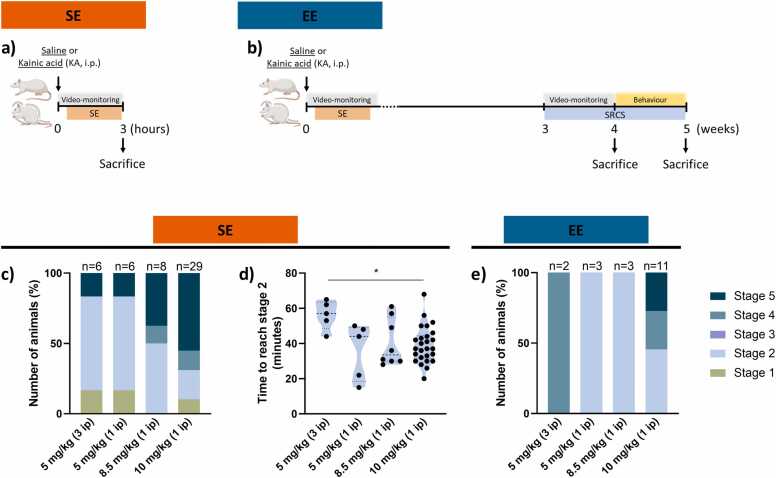
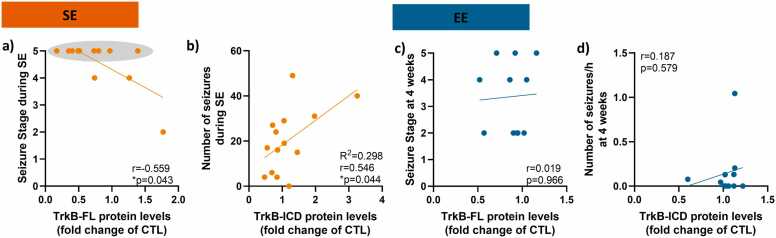
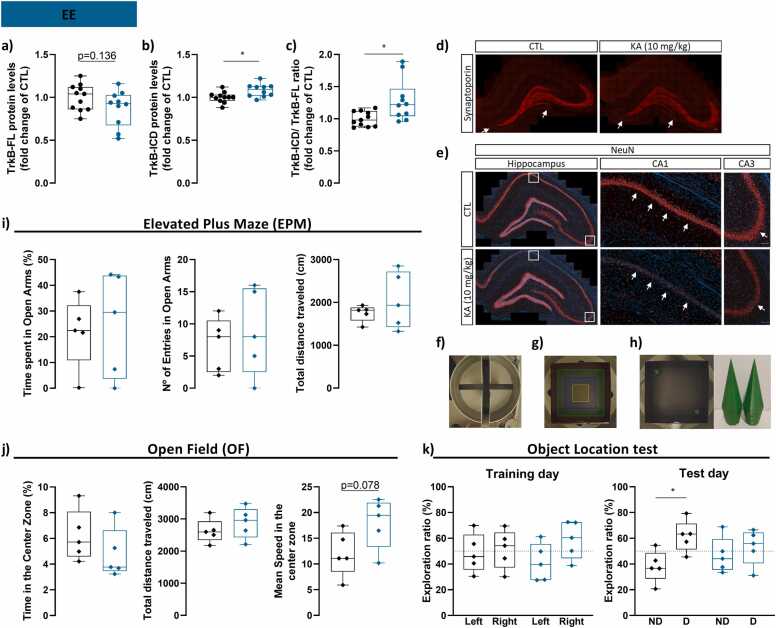
Brain-derived neurotrophic factor (BDNF) is essential for neuronal survival, differentiation, and plasticity. In epilepsy, BDNF exhibits a dual role, exerting both antiepileptic and pro-epileptic effects. The cleavage of its main receptor, full-length tropomyosin-related kinase B (TrkB-FL), was suggested to occur in status epilepticus (SE) in vitro. Moreover, under excitotoxic conditions, TrkB-FL was found to be cleaved, resulting in the formation of a new intracellular fragment, TrkB-ICD. Thus, we hypothesized that TrkB-FL cleavage and TrkB-ICD formation could represent an uncovered mechanism in epilepsy. We used a rat model of mesial temporal lobe epilepsy (mTLE) induced by kainic acid (KA) to investigate TrkB-FL cleavage and TrkB-ICD formation during SE (∼3 h after KA) and established epilepsy (EE) (4-5 weeks after KA). Animals treated with 10 mg/kg of KA exhibited TrkB-FL cleavage during SE, with hippocampal levels of TrkB-FL and TrkB-ICD correlating with seizure severity. Notably, TrkB-FL cleavage and TrkB-ICD formation were also detected in animals with EE, which exhibited spontaneous recurrent convulsive seizures, neuronal death, mossy fiber sprouting, and long-term memory impairment. Importantly, hippocampal samples from patients with refractory epilepsy also showed TrkB-FL cleavage with increased TrkB-ICD levels. Additionally, lentiviral-mediated overexpression of TrkB-ICD in the hippocampus of healthy mice and rats resulted in long-term memory impairment. Our findings suggest that TrkB-FL cleavage and the subsequent TrkB-ICD production occur throughout epileptogenesis, with the extent of cleavage correlating positively with seizure occurrence. Moreover, we found that TrkB-ICD overexpression impairs memory. This work uncovers a novel mechanism in epileptogenesis that could serve as a potential therapeutic target in mTLE, with implications for preserving cognitive function.

Keywords: BDNF; Cognition; Spontaneous seizures; Status epilepticus; TrkB-ICD.


Conflict of interest statement

Declaration of Competing Interest The authors declare the following financial interests/personal relationships which may be considered as potential competing interests: João Fonseca-Gomes has patent #PCT/PT2021/050011 pending to Assignee. Maria Jose Diógenes has patent #PCT/PT2021/050011 pending to Assignee. Ana Maria Sebastião has patent #PCT/PT2021/050011 pending to Assignee. If there are other authors, they declare that they have no known competing financial interests or personal relationships that could have appeared to influence the work reported in this paper.

Figures

None
Graphical abstract
Fig. 1
Fig. 1
Flowchart showing the animals used in the kainic acid (KA)-induced model of mesial temporal lobe epilepsy (mTLE) throughout the study. SRCS, spontaneous recurrent convulsive seizures.
Fig. 2
Fig. 2
Flowchart showing the mice and rats used in the experiments using lentiviral injections throughout the study. PBS, phosphate-buffered saline. eGFP, enhanced green fluorescent protein.
Fig. 3
Fig. 3
Experimental design of kainic acid (KA)-induced model of mesial temporal lobe epilepsy (mTLE) during status epilepticus (SE) (a) or during established epilepsy (EE) (b). (a) Animals were sacrificed 3 hours after the KA injection during SE. (b) Animals were sacrificed during EE at 4 weeks after the KA injection or 5 weeks after the KA injection after performing behavioral tests. (c-e) The seizure stage during SE and during EE depends on the dose of KA. (c) Distribution of maximum seizure stage reached during SE after different intraperitoneal (i.p.) dose regimens of kainic acid (KA). (d) Time to reach seizure stage 2 after different dose regimens of KA (n = 5–26). (e) Distribution of maximum seizure stage reached during EE, after SE induction by different dose regimens of KA. Statistical analysis was performed using Brown-Forsythe ANOVA and Welch ANOVA tests followed by Dunnett's T3 multiple comparisons test. i.p., intraperitoneal injection. SRCS, spontaneous recurrent convulsive seizures. Panels a and b created with BioRender.com.
Fig. 4
Fig. 4
Hippocampal protein levels of animals treated with different dose regimens of kainic acid (KA) and sacrificed during status epilepticus (SE) (a-c, orange) or during established epilepsy (EE) (d-f, blue) are changed depending on the KA administered dose. (a) TrkB-FL levels, (b) TrkB-ICD levels, and (c) TrkB-ICD/TrkB-FL ratio of animals sacrificed on the SE day (CTL: n = 8; 5 mg/kg (3 i.p.): n = 4; 5 mg/kg (1 i.p.): n = 3; 8.5 mg/kg (1 i.p.): n = 5; 10 mg/kg (1 i.p.): n = 14). (d) TrkB-FL levels, (e) TrkB-ICD levels, and (f) TrkB-ICD/TrkB-FL ratio of animals sacrificed during EE (CTL: n = 14; 5 mg/kg (3 i.p.): n = 2; 5 mg/kg (1 i.p.): n = 3; 8.5 mg/kg (1 i.p.): n = 3; 10 mg/kg (1 i.p.): n = 10). Control animals in all experiments were treated with saline (black). Statistical analysis was performed using Brown-Forsythe ANOVA and Welch ANOVA tests (a, c, d, e, f) or Kruskal-Wallis test (b), all followed by Dunnett's multiple comparisons tests. Results are shown as median, minimum, 25 % and 75 % percentile, and maximum. *p < 0.05, versus CTL group.
Fig. 5
Fig. 5
TrkB-FL levels are lower in hippocampal samples from animals treated with 10 mg/kg of KA and higher seizure stage during status epilepticus (SE). (a) Spearman correlation between the hippocampal TrkB-FL protein levels and seizure stage during SE (n = 14). (b) Pearson correlation between the hippocampal TrkB-ICD protein levels and the number of seizures during SE (n = 14). (c) Spearman correlation between the hippocampal TrkB-FL protein levels and seizure stage during established epilepsy (EE) (n = 11). (d) Spearman correlation between the hippocampal TrkB-ICD protein levels and the number of seizures per hour during EE (n = 11). Grey oval shape indicates all animals with stage 5 seizures.
Fig. 6
Fig. 6
Cleavage of TrkB-FL during status epilepticus (SE) occurs in animals treated with 10 mg/kg of kainic acid (KA) displaying stage 5 seizures. (a) TrkB-FL levels, (b) TrkB-ICD levels, and (c) TrkB-ICD/TrkB-FL ratio from the hippocampus of control animals (black, n = 6) and animals treated with 10 mg/kg of KA that experienced stage 5 seizures (orange, n = 11) during SE. (d-e) Pearson correlation between the TrkB-ICD protein levels in the hippocampus and the SE duration (d) or the number of seizures during SE (e) (n = 11). Statistical analysis was performed using an unpaired t-test with Welch's correction (a-c). Results are shown as median, minimum, 25 % and 75 % percentile, and maximum. *p < 0.05, **p < 0.01, versus CTL.
Fig. 7
Fig. 7
Animals treated with 10 mg/kg of kainic acid (KA) present TrkB-FL cleavage, mossy fiber sprouting, and neuronal death in the hippocampus, as well as, spatial memory impairment during established epilepsy (EE). (a) TrkB-FL levels, (b) TrkB-ICD levels, and (c) TrkB-ICD/TrkB-FL ratio from the hippocampus of control animals (black, n = 11) and animals treated with 10 mg/kg of KA (blue, n = 10) during EE. Immunohistochemical staining for synaptoporin (d) and NeuN (e) in the hippocampus of control animals and animals treated with 10 mg/kg of KA. White squares indicate the amplified CA1 and CA3 regions. Arrows indicate mossy fiber sprouting (d) or neuronal loss (e). Scale bar:100 µm. (f) Elevated plus maze. (g) Open field arena with virtual areas. (h) Objects used during the object location test and an example of its location during the test day. Evaluation of (i) elevated plus maze, (j) open field test, and (k) object location test in control animals (black, n = 5) and animals treated with 10 mg/kg of KA (blue, n = 5) during EE. Statistical analysis was performed using an unpaired t-test with Welch's correction (a, c, i, and j), Mann-Whitney test (b), or paired t-test (k). Results are shown as median, minimum, 25 % and 75 % percentile, and maximum. *p < 0.05 versus CTL. ND, No-displaced. D, displaced.
Fig. 8
Fig. 8
Cleavage of TrkB-FL occurs in human hippocampal samples from patients with refractory epilepsy. (a) Representative western blot bands of TrkB-FL (∼145 kDa), TrB-ICD (∼32 kDa), and GAPDH (∼37 kDa) of post-mortem tissue from control (CTL) humans and of resected epileptic tissue from patients with refractory epilepsy. (b) TrkB-FL protein levels, (c) TrkB-ICD protein levels, and (d) TrkB-ICD/TrkB-FL ratio of post-mortem tissue from control patients (black, n = 7) and of epileptic tissue resected from patients with refractory epilepsy (green, n = 11). Statistical analysis was performed using the Mann-Whitney test (b) or unpaired t-test with Welch's correction (c and d). Results are shown as median, minimum, 25 % and 75 % percentile, and maximum. **p < 0.01, ***p < 0.001, versus CTL.
Fig. 9
Fig. 9
Design and overexpression of lentiviral vectors. (a) Constructs of lentiviral vectors expressing eGFP or TrkB-ICD. (b) Representative immunofluorescence images showing eGFP fluorescence from a slice of an animal injected with eGFP lentiviral vector (left panel) and ZsGreen fluorescence from a slice of an animal injected with TrkB-ICD lentiviral vector (right panel). Images were acquired with a widefield fluorescence microscope (Axiovert 200, ZEISS). Scale bar: 100 µm.
Fig. 10
Fig. 10
C57Bl/6 J mice overexpressing TrkB-ICD exhibit long-term memory impairment. (a) Experimental design for animals injected with eGFP or TrkB-ICD lentiviral vectors, injected with a vehicle solution (phosphate-buffered saline, PBS), or not subjected to surgery. C57Bl/6 J mice performed behavioral tests 6 weeks after lentiviral injection and were subsequently sacrificed for electrophysiological studies. (b-e) Evaluation of the different behavioral tests: (b) elevated plus maze, (c) open field, (d) novel object recognition, and (e) Morris water maze. The assessed groups included: control animals with no surgery (CTL, dark grey, n = 15), animals injected with PBS (grey, n = 10), animals injected with lentivirus for eGFP overexpression (green, n = 12, except for NOR: n = 11), and animals injected with lentivirus for TrkB-ICD overexpression (blue, n = 14). Statistical analysis was performed using one-way ANOVA followed by Dunnett's multiple comparisons tests (b, c, novelty preference index in (d), and time in the correct quadrant and the number of crossings in (e)), paired t-test (exploration ratio in (d)) and mixed-effects analysis (latency to target in (e)). Results are shown as median, minimum, 25 % and 75 % percentile, and maximum. *p < 0.05, **p < 0.01, ***p < 0.001, ****p < 0.0001. Panel a created with BioRender.com.
Fig. 11
Fig. 11
TrkB-ICD overexpression in the hippocampus of C57Bl/6 J mice promoted a dysfunctional increase in long-term synaptic plasticity, without affecting short-term synaptic plasticity. (a) Time courses of averaged normalized changes in field excitatory postsynaptic potentials (fEPSP) slope after delivery (0 min) of a weak θ-burst (3 ×3) in all conditions (CTL, dark grey, n = 6; PBS, grey, n = 5; eGFP, green, n = 7; TrkB-ICD, blue n = 6). Representative traces were recorded before and after long-term potentiation (LTP) induction from the experimental group identified above each trace. (b) Post-tetanic potentiation (PTP) magnitude after θ-burst stimulation (change in fEPSP slope at 0–6 minutes (recorded in a), compared to baseline) in all conditions. (c) LTP magnitudes from the recordings in (a) (change in fEPSP slope at 50–60 min compared to baseline). Statistical analysis was performed using a one-way ANOVA followed by Dunnett's multiple comparisons test (b and c). Results are shown as median, minimum, 25 % and 75 % percentile, and maximum. *p < 0.05, ***p < 0.001, versus TrkB-ICD.

References

    1. Miranda-Lourenço* C., Ribeiro-Rodrigues* L., Fonseca-Gomes* J., Tanqueiro* S.R., Belo* R.F., Ferreira C.B., et al. Challenges of BDNF-based therapies: from common to rare diseases. Pharm. Res. 2020;162:105281. - PubMed
    1. Lau S., Xifró X., Wang Q., Wang Z.H., Z-h W., Li Y., et al. The role of brain derived neurotrophic factor in central nervous system. Front Aging Neurosci. 2022;14 - PMC - PubMed
    1. Hou X., Wang X., Zhang L. Conditional downregulation of brain- derived neurotrophic factor and tyrosine kinase receptor B blocks epileptogenesis in the human temporal lobe epilepsy hippocampus. Neurol. India. 2010;58(1):29. - PubMed
    1. Takahashi M., Hayashi S., Kakita A., Wakabayashi K., Fukuda M., Kameyama S., et al. Patients with temporal lobe epilepsy show an increase in brain-derived neurotrophic factor protein and its correlation with neuropeptide Y. Brain Res. 1999;818:579–582. - PubMed
    1. Rudge J.S., Mather P.E., Pasnikowski E.M., Cai N., Corcoran T., Acheson A., et al. Endogenous BDNF protein is increased in adult rat hippocampus after a kainic acid induced excitotoxic insult but exogenous BDNF is not neuroprotective. Exp. Neurol. 1998;149:398–410. - PubMed

LinkOut - more resources