. 2025 Apr;14(7):e037531.
doi: 10.1161/JAHA.124.037531. Epub 2025 Mar 21.

Blockade of YAP Mechanoactivation Prevents Neointima Formation and Adverse Remodeling in Arterialized Vein Grafts

Affiliations

Blockade of YAP Mechanoactivation Prevents Neointima Formation and Adverse Remodeling in Arterialized Vein Grafts

Gloria Garoffolo et al. J Am Heart Assoc. 2025 Apr.

Abstract

Background: Bypass surgery using saphenous vein (SV) grafts is commonly performed to revascularize the ischemic heart and lower limbs. These interventions have limited success due to adverse remodeling caused by overproliferation of smooth muscle cells in the intima layer, leading to progressive bypass stenosis. We previously showed that cyclic strain deriving from exposure to coronary flow induces the expression of the matricellular protein thrombospondin-1 in the human SV, promoting activation of progenitor cells normally residing in the adventitia.

Methods: We analyzed the data of an RNA-sequencing profiling of human SV progenitors subjected to uniaxial strain we previously performed by. Experiments in cell culture, ex vivo, and in vivo vein arterialization models were performed to substantiate findings with particular reference to the role of mechanically activated transcription factors. Validation was performed in vitro and in ex vivo/in vivo models of vein graft disease.

Results: Results of bioinformatic assessment of the RNA-sequencing data indicated Yes-associated protein (YAP) as a possible mechanically regulated effector in pathologic evolution of SV progenitors. Inhibition of YAP by verteprofin-a drug that abolishes the interaction of YAP with Tea Domain DNA-binding proteins-reduced the expression of pathologic markers in vitro and reduced intima hyperplasia in vivo.

Conclusions: Our results reveal that desensitizing the SV-resident cells to mechanoactivation of YAP is feasible to reduce the graft disease progression.

Keywords: TGF‐β; YAP; mechanical strain; vein graft disease; verteporfin.


Conflict of interest statement

None.

Figures

Figure 1
Figure 1. Mechanosensitivity of human SVPs and activation of YAP–dependent signaling.
A, Human SVPs subjected to cyclic strain (10% elongation, 1 Hz frequency) for 72 hours underwent extensive orientation changes. Cells were stained with phalloidin TRITC (red) and DAPI. The graph indicates the difference in the alignment of the major axis of the nuclei (indicative of orientation of the whole cellular body) in a perpendicular direction to the strain (vertical in the lower micrograph). B, Heatmap representing the results of an unsupervised cluster analysis and relative volcano plot indicating the genes that, by RNA sequencing, were found to be differentially expressed in mechanically stimulated (ON) vs statically cultured (OFF) SVPs for 72 hours. Red dots in the volcano plot represent genes that are upmodulated/downmodulated by |log2FC|>1, with an adjusted P value <0.05. C, Bubble plot representing upregulated Gene Ontology pathways significantly enriched in the ON vs OFF comparison. As is evident, this comparison produced enrichment of numerous pathways connected with extracellular matrix remodeling and binding and smooth muscle cells proliferation and differentiation. D, Unsupervised cluster analysis of the differentially expressed genes with a Hippo pathway functional annotation. The heatmap shows the majority of genes that were upregulated in the ON vs OFF condition. This included genes belonging to the TGF‐β pathways (eg, TGFBR1, TGFB1, SMAD7) and Wnt‐dependent signaling (eg, FZD1/8, WNT5A, GLI2, DVL1/3). Part of these genes were confirmed by real‐time quantitative polymerase chain reaction on independent RNA samples (see graphs on the right of the panel with indication of the significance in pairwise comparison). E, Effect of cyclic straining on YAP nuclear translocation. Immunofluorescence staining of cells cultured in static or dynamic conditions for 72 hours was performed with YAP‐specific antibodies, followed by quantitative analysis of nYAP+ and nYAP cells (white and yellow arrows, respectively). Pairwise comparison of the 2 conditions revealed a significant increase of nYAP+ cells in dynamically cultured cells. F, Mechanical stimulation led to a significant decrease of pYAP at Ser127. This was independent of the Hippo kinase pathway modulation, as demonstrated by an equal level of the pLATS. G, Assessment of canonical YAP transcriptional targets CTGF, ANKRD1, and CTGF expression under static and dynamic conditions establishes the role of YAP as a transcriptional mechanosensory in SVPs. H, TEAD 1–4, but not the 14‐3‐3 interaction with YAP is increased in mechanically stimulated cells, as shown by immunoprecipitation/Western analysis followed by quantification. In all graphs, red dots overlapping the bars indicate the result of each experiment performed the in independent cell lines. The data represented in the bar graph in (A, D, F, G, and H) were compared by pairwise t test. The P values are indicated above the significance lines. DAPI indicates 4',6‐diamidino‐2‐phenylindole; LATS, large tumor suppressor kinase; nYAP; nuclear YAP; pLATS,phosphorylated form of large tumor suppressor kinase; pYAP, phosphorylated YAP; SVP, saphenous vein progenitor; TEAD, TEA domain transcription factor; TGF‐β, transforming growth factor β; TRITC, tetramethylrhodamine isothiocyanate; and YAP, Yes‐associated protein.
Figure 2
Figure 2. Dependency of YAP transcriptional activation by cytoskeleton tensioning.
A, SVPs plated onto dishes with Mega Pascal mechanical compliance were treated with FRSK, an activator of the adenylate cyclase and the cyclic adenosine monophosphate/ PKA pathway for 6 hours, followed by recovery for an overnight period. The panels on the top show the reversible depolymerization of the F‐actin cytoskeleton. White arrows indicate cells with nYAP+ nuclei, while white arrows show nYAP cells; quantification of these cells is shown in the upper right bar graph. The images on the bottom of the panel show the rendering of the YAPnucl/YAPcyto ratio as detected by the CARE algorithm. The nuclei of the cells (and the arrows pointing at some of these nuclei) are represented with a different color to discriminate differences in the YAPnucl/YAPcyto ratio. The color code adopted for this representation is indicated in the bar on the right side of the panels and graphic representation of the YAPnucl/YAPcyto ratio is included in the lower right bar graph. B, Western/ RT‐qPCR analyses to detect the effects of FRSK treatment on P‐YAP (Ser127) and expression of canonical target genes. As shown in the Western analysis, treatment of SVPs with the PKA activator transiently increased the level of pYAP, consistent with the reversible effect on nuclear localization observed in (A). Inhibition of canonical targets CTGF, CYR61, and ANKRD1 also showed a transient inhibition of the YAP transcriptional activity (more pronounced for CYR61 and ANKRD1) and the downregulation of the YAP gene itself. C, Transwell migration assay of static and dynamically cultured SVPs for 72 hours. As shown in the panels on the left, mechanically stimulated cells (72 hours) migrated more efficiently than those maintained in static culture. Treatment with FRSK inhibited this effect (panel on the right). D, Implication of YAP and TEAD in SVPs migration was assessed by siRNA–mediated knockdown experiment. The upper left graphs indicate the downregulation of both transcription factors at a transcriptomic level by RT‐qPCR vs the control and scrambled siRNAs. The micrographs on the right show an example of a transwell migration assay performed with control, scrambled siRNA, and YAP/TEAD4 siRNA sequences. As shown, siRNA‐mediated downregulation of both transcription factors reduced SVP motility. Quantification of the SVP motility is shown in the bottom bar graph. Data in bar graphs were compared by 1‐way ANOVA (repeated‐measures) with Tukey (A, B, D; Western blot or RT‐qPCR) or Dunnet post hoc tests (D, migration), and by paired t test in the other graphs. In all graphs, the red dots overlapping the bars indicate the result of each experiment performed in independent cell lines. The P values are indicated above the significance lines. CARE indicates Content‐Aware Image Restoration; CTRL, control group; DAPI, 4',6‐diamidino‐2‐phenylindole; FBS, fetal bovine serum; FRSK, forskolin; nYAP, nuclear YAP; PKA, protein kinase A; P‐YAP, phosphorylated YAP; REC, recovery; RT‐qPCR, real‐time quantitative polymerase chain reaction; Scr, scrambled small interfering RNA group; siRNA, small interfering RNA; SVP, saphenous vein progenitors; TEAD, TEA domain transcription factor; and YAP, Yes‐associated protein.
Figure 3
Figure 3. Cooperation of TEAD 4/ TGF‐β transcriptional signaling to mechanoactivation of human SVPs.
A, Bubble plot of the most represented group of genes contained in their promoter consensus binding sequences of the indicated transcription factors. TEAD4, indicated in red, is one of the most common YAP transcriptional interactors in transcriptional complexes. The gene network represented on the right of the panel indicates the genes that contain the TEAD4 consensus in their promoters and are putatively regulated by YAP/TEAD4 complexes. Note the presence of numerous genes linked to extracellular matrix binding and remodeling, YAP target genes, and genes connected to TGF‐β signaling. B, Bubble plot representation of an enrichment analysis of the genes containing the 2 TEAD4 consensus binding sequences shown in (A). Among these pathways, again, there was an association of genes to extracellular matrix remodeling and binding and response to TGF‐β, suggesting a functional cooperation of the YAP/TEAD4 complex with the TGF‐β signaling. C, Potentiation of the YAP‐dependent signaling by TGF‐β and TSP‐1. The panels show immunofluorescence staining of SVPs plated onto Mega Pascal substrates in the presence of TGF‐β, TSP‐1, or a combination of both (T+T). As shown in the immunofluorescence panels, the addition of the single factors enhanced YAP nuclear translocation compared with controls. The T+T combination was, however, the most effective as evidenced by the analysis of the YAP nuclear/cytoplasmic ratio with the CARE algorithm, which indicated a significantly higher YAPnucl/YAPcyto ratio in cells treated with T+T compared with control or single treatments. As in Figure 2A, the nuclei of the cells (and the arrows pointing at some of these nuclei) are represented with a different color to discriminate differences in the YAPnucl/YAPcyto ratio. The color code adopted for this representation is indicated in the bar on the top right panels and a graphic representation of the YAPnucl/YAPcyto ratio is included in the graph on the right. D, Stimulation with T+T increased the proliferation of SVPs and the expression (both at the RNA and protein levels) of SM22α early SMC marker. On the top of the panel immunofluorescence shows proliferating cell nuclear antigen (PCNA) as a cell growth marker (note the difference in the number of PCNA+ cells [white arrows] vs PCNA cells [yellow arrows]), in the T+T compared with control treatment. Quantification of the cells expressing PCNA is represented in the lower left bar graph. Quantification of TAGLN (SM22α) RNA by real‐time quantitative polymerase chain reaction and protein by Western analysis was performed to show that treatment with T+T increases SMC differentiation of SVPs. Statistical comparisons were performed by 1‐way ANOVA (repeated‐measures) with Tukey post hoc in (C) and by paired t test in (D). In all graphs, the red dots overlapping the bars indicate the result of each experiment performed in independent cell lines. The P values are indicated above the significance lines. CARE indicates Content‐Aware Image Restoration; C/CTRL, control group; DAPI, 4',6‐diamidino‐2‐phenylindole; SMC, smooth muscle cell; SVP, saphenous vein progenitors; TEA, TEA domain transcription factor; TGF‐β, transforming growth factor β; TSP‐1, thrombospondin 1; and YAP, Yes‐associated protein.
Figure 4
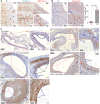
Figure 4. Dynamics of YAP upregulation in various models of vein arterialization.
A, Exceeding SV conduits recovered from the surgery theater were immediately processed for histology (T0), mounted, and stimulated for 2 weeks in a bioreactor tailored to reproduce a flow with low pressure, typical of the VP, or the counter pulsed coronary circulation, typical of the coronary bypass. Pictures represent transversal sections of the vessels after unmounting from the bioreactors and following histological sectioning and YAP immunohistochemistry. Under these conditions, the cells in CABG–stimulated SVs exhibited a clear upregulation of YAP in the nuclei of the cells in the media (red arrows in the inset). B, Transverse sections of pig SVs before and 90 days after implantation into carotids. Evident from the panels in freshly harvested SVs, the expression of YAP was negligible, while at 90 days, several cells in the vein wall were characterized by the presence of the co‐factor in the nuclei (red arrows in the inset). Quantification of the cells was performed in 3 independent samples (bar graph on the right). The number of animals included in the quantification is indicated by the red circles overlapping in the bar graph. C, The upregulation of YAP in a model of vena cava into carotid interposition in mice was also tested at different times. The images show the transverse section of preimplant and postimplant vena cava immunostained with YAP‐specific antibody. It is evident that before implantation, the cells did not express the transcription factor. After implantation, an increasing number of YAP+ cells were found either in the media (me) or the adventitia (Adv) of the vessel starting at 3 days. Some endothelial cells (ECs; blue arrows) also expressed the factor in line with the role of YAP as a mechanosensor of shear stress. Note the increasing signal of nuclear YAP (red arrows) in cells of the hyperplastic intima (IH) starting at day 21 and culminating at day 28, in keeping with the lumen reduction. The data represented in the bar graph in panel B were compared by unpaired t test. The P values are indicated above the significance lines. CABG indicates coronary artery bypass graft; SV, saphenous vein; VP, venous perfusion; and Yes‐associated protein.
Figure 5
Figure 5. Interference with YAP transcriptional activity reduces sensitivity to TGF‐β/TSP‐1 signaling.
A, Treating cells with VTP reduces expression of the transcriptional cofactor and migratory activity of human SVPs in transwells. The top left of the panel shows Western blotting analysis of SVPs treated with VTP. Quantification of the Western analysis is shown below. In the center of the panel there is a representative image of the migration assay performed in transwells with control and VTP‐treated SVPs; the relative quantification is in the top right. VTP also downregulated expression of CD47, one of the main TSP‐1 receptors that have been demonstrated to be relevant for migration of these cells. B, VTP reduces the amount of the focal adhesion contacts in SVPs. The left of the panel represents control cells showing a high number of vinculin‐stained focal contacts (arrows). VTP significantly inhibited formation of focal contacts/cells, as shown in the bar graph. C, PLA performed with YAP and phospho‐SMAD3–specific antibodies. The proximity of the 2 transcriptional cofactors was followed by quantifying the red signal in the nuclei of control cells and cells treated with TGF‐β, TSP‐1, and the TGF‐β/TSP‐1 combination (T+T; see the fluorescence profiles overlapping the nuclei of the cells). Evident from the representative images, the red signal was significantly elevated in cells treated with the T+T combination (bar graph on the right). This increase was reverted by VTP, indicating a functional cooperation of TGF‐β and TSP‐1 with nuclear signaling by YAP. D through E, The TGF‐β/TSP‐1 combination also elevated the RNA expression of key fibrotic/myofibroblasts markers, including fibronectin (FN), ACTA‐2 (encoding for αSMA), and TSP‐1 itself (THBS1). The combination also elevated the messenger RNA expression and secretion of collagen 1. In all cases, the addition of VTP reduced the expression of these markers to control levels. Statistical comparisons were performed by pairwise Student t test in (A) and (B) and by 1‐way ANOVA (repeated‐measures) with Tukey post hoc in (C through E). In all graphs, the red dots overlapping the bars indicate the result of each experiment performed in independent cell lines. The P values are indicated above the significance lines. CTRL indicates control group; SVP; saphenous vein progenitors; TGF‐β, transforming growth factor β; TSP‐1,thrombospondin 1; VTP, verteporfin; and YAP, Yes‐associated protein.
Figure 6
Figure 6. In vivo administration of VTP blunts progression of vein graft disease in mice.
A, The right side of the panel illustrates the experimental protocol used in our in vivo approach. ApoE*3‐Leiden mice were subjected to a high‐fat diet for 21 days before the surgery. After vena cava into carotid interposition, each mouse was monitored by ultrasound at days 7, 10, 14, and 21 after surgery. The intraperitoneal administration of VTP (or vehicle as a control) started at day 10 after surgery. Euthanasia of mice and harvesting of biological material (veins, blood) occurred at day 28 after surgery. The 2 micrographs on the left show a low magnification of the transverse sections of mouse arterialized veins at 28 days postimplant into carotids. Histological sections were stained with Movat pentachrome solution. In mice injected with the control solution (vehicle), the presence of an abundant accumulation of IH and a secondary atherosclerotic plaque is evident, well separated from the preexisting Me. Systemic administration of VTP attenuated intima hyperplasia and, at least in part, reduced the formation of the plaques. B, The micrographs show immunofluorescence staining of the veins with antibodies specific for αSMA (red staining) and CD31 (yellow staining). As shown in the pictures, injection of VTP reduced the number of αSMA+ cells in the vein wall and promoted maturation of the neovasculature present in neointima, indicative of reduced atherosclerosis, as shown by the higher number of vessels characterized by coverage of CD31+ endothelial layer by αSMA+ cells (arrows, compare the structure of these vessels in the control vs VTP‐treated veins). C, Quantification of vessel morphometry (% wall area, I/M ratio), αSMA (ACTA2) intensity, circulating (pg/mL blood), vessel neoformation (density/mm2), and vessel maturation (% of vessels covered by smooth muscle cells). D, VTP significantly reduces the expression of TSP‐1. The micrographs indicate the immunohistochemistry of the explanted vein grafts in control and VTP‐injected mice. It is evident the reduction in the positive area in treated mice compared with controls (quantification in the bar graph on the right). Data in the bar graphs were compared by unpaired t test. In all graphs, the red dots overlappping the bars indicate the result of each experiment performed in independent animals. The P values are indicated above the significance lines. IL6 indicates interleukin 6; I/M, intima/media; IH, intimal; Me, media; TSP, thrombospondin 1; and VTP, vertepofrin.

References

    1. Gaudino M, Benedetto U, Fremes S, Ballman K, Biondi‐Zoccai G, Sedrakyan A, Nasso G, Raman J, Buxton B, Hayward PA, et al. Association of radial artery graft vs saphenous vein graft with long‐term cardiovascular outcomes among patients undergoing coronary artery bypass grafting. JAMA. 2020;324:179–187. doi: 10.1001/jama.2020.8228 - DOI - PMC - PubMed
    1. Xenogiannis I, Zenati M, Bhatt DL, Rao SV, Rodes‐Cabau J, Goldman S, Shunk KA, Mavromatis K, Banerjee S, Alaswad K, et al. Saphenous vein graft failure: from pathophysiology to prevention and treatment strategies. Circulation. 2021;144:728–745. doi: 10.1161/CIRCULATIONAHA.120.052163 - DOI - PubMed
    1. Arsalan M, Mack MJ. Coronary artery bypass grafting is currently underutilized. Circulation. 2016;133:1036–1045. doi: 10.1161/CIRCULATIONAHA.115.018032 - DOI - PubMed
    1. Farber A, Menard MT, Conte MS, Kaufman JA, Powell RJ, Choudhry NK, Hamza TH, Assmann SF, Creager MA, Cziraky MJ, et al. Surgery or endovascular therapy for chronic limb‐threatening ischemia. N Engl J Med. 2022;387:2305–2316. doi: 10.1056/NEJMoa2207899 - DOI - PubMed
    1. Caliskan E, de Souza DR, Boning A, Liakopoulos OJ, Choi YH, Pepper J, Gibson CM, Perrault LP, Wolf RK, Kim KB, et al. Saphenous vein grafts in contemporary coronary artery bypass graft surgery. Nat Rev Cardiol. 2020;17:155–169. doi: 10.1038/s41569-019-0249-3 - DOI - PubMed

MeSH terms