. 2025 Apr;14(7):e037242.
doi: 10.1161/JAHA.124.037242. Epub 2025 Mar 21.

Decreased Extracellular Vesicle Vasorin in Severe Preeclampsia Plasma Mediates Endothelial Dysfunction

Affiliations

Decreased Extracellular Vesicle Vasorin in Severe Preeclampsia Plasma Mediates Endothelial Dysfunction

Saravanakumar Murugesan et al. J Am Heart Assoc. 2025 Apr.

Abstract

Background: Preeclampsia is a serious pregnancy complication affecting 5% to 8% of pregnancies globally. preeclampsia is a leading cause of maternal and neonatal morbidity and death. Despite its prevalence, the underlying mechanisms of preeclampsia remain unclear. This study investigated the role of vasorin in preeclampsia pathogenesis by examining its levels in extracellular vesicles (EVs) and effects on vascular function.

Methods and results: We conducted unbiased proteomics on urine-derived EVs from women with severe preeclampsia and normotensive pregnancies, identifying differentially abundant proteins. Vasorin expression levels were measured in urinary EVs, plasma EVs, and placental tissue. EVs were generated from human and murine placental explants. Vascular functions were assessed using murine aortic rings and human aortic endothelial cells. Vasorin expression was manipulated in human aortic endothelial cells via overexpression and knockdown followed by RNA sequencing. One hundred twenty proteins showed ≥±1.5-fold regulation (P<0.05) between severe preeclampsia and NTP. Vasorin levels decreased in severe preeclampsia in urinary EVs, plasma EVs, and placental tissue. Vasorin levels increased with gestational age in murine pregnancy and were diminished in a murine model of preeclampsia. Severe preeclampsia and murine preeclampsia EVs impaired human aortic endothelial cell migration and inhibited murine aortic ring vasorelaxation. Vasorin overexpression counteracted these effects. RNA sequencing showed that vasorin manipulation in human aortic endothelial cells differentially regulated hundreds of genes linked to vasculogenesis, proliferation, migration, and apoptosis.

Conclusions: The data suggest that vasorin, delivered to the endothelium via EVs, regulates vascular function and that the loss of EV vasorin may be one of the mechanistic drivers of preeclampsia.

Keywords: extracellular vesicles; human aortic endothelial cells; placental explant culture; preeclampsia; short FMS‐like tyrosine kinase 1; vasorin.


Conflict of interest statement

None.

Figures

Figure 1
Figure 1. Unbiased proteomic analysis of urinary EV from NTP and sPE.
Urine was collected form a cohort of women with NTP or sPE (n=10 NTP and n=10 sPE), EVs were isolated and unbiased proteomic analysis was performed as described in Methods. A, Results of PCA performed on normalized counts of all detected proteins in the samples. B, Heat map with hierarchical clustering performed on the same samples and detected proteins as were used for the PCA. Both PCA and hierarchical clustering indicate separation of the NTP and sPE groups and clustering of samples belonging to each group. C, List of the top 20 significantly regulated proteins between the groups ranked in the order of absolute Z scores. Colors represent row‐normalized Z scores. We highlighted vasorin as the subject of our follow‐up study. D, Dot plots of DO analysis using either ORA (left) or GSEA (right). E, Depicts gene concept network of the identified proteins as they relate to pathways shown in DO ORA. Relative change of quantities of individual proteins is indicated by the color of the dot representing them; decrease (blue) or increase (magenta). The most significantly regulated DO pathways prominently feature disease processes related to vascular, kidney, and hepatic diseases and include preeclampsia. DO indicates disease ontology; EV, extracellular vesicle; GSEA, gene set enrichment analysis; NTP, normotensive pregnancy; ORA, overrepresentation analysis; PCA, principal component analysis; and sPE, severe preeclampsia.
Figure 2
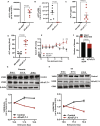
Figure 2. Characterization of EVs, and vasorin levels in plasma EVs, total plasma, EV‐depleted plasma, and placenta from NTP and sPE pregnant women.
EV were isolated from plasma of the NTP and sPE groups then (A) transmission electron microscopy was performed to assess morphology. Scale bar: 100 nm. Both groups display typical EV morphology, characterized by cup‐shaped structures within the size range consistent with EV. B, Particle size for both EV groups were determined by nanoparticle tracking analysis. No statistically significant difference was observed in size distribution between NTP and sPE EVs (t test). C, We performed western blot analysis of isolated plasma EVs, along with whole plasma, HAEC lysates and PBS as a negative control for EV. Lanes represent samples probed with specific antibodies: CD63 and TSG101 (enriched EV markers), GM130 (a Golgi marker to exclude cellular contamination), and apolipoprotein A1 (a plasma protein). The EV fraction displays enrichment, and the EV‐depleted plasma is void of the known EV markers (CD63 and TSG101), while it lacks GM130 and contains apolipoprotein A1. D, Quantitative analysis of vasorin and TSG101 enrichment and depletion in EV and EV‐depleted plasma, respectively. Quantitative analysis of vasorin level changes by western blotting in sPE vs NTP plasma EVs (E), and placenta samples (F), and by real time PCR in plasma samples (G). Vasorin protein is decreased in sPE compared with NTP EVs, with TSG101 used as an EV marker for normalization. This pattern was also observed in placenta tissue (F), suggesting potential vasorin depletion from plasma by EV isolation. Western blotting confirmed the presence of vasorin within isolated plasma EV (G). H, RNA isolated from placenta samples demonstrated a downregulation of vasorin mRNA levels in the sPE group compared with NTP. Data were presented as the mean±SEM. Numerical P values are shown as determined by 2‐tailed, unpaired t test. EV indicates extracellular vesicle; HAEC, human aortic endothelial cell; ns, no statistically significant difference; NTP, normotensive pregnancy; sPE, severe preeclampsia; and VASN, vasorin.
Figure 3
Figure 3. Levels of vasorin in placenta tissue and plasma EVs in normal murine pregnancy and in the sFLT‐1 overexpression murine model of preeclampsia.
Timed pregnant mice were injected intravenously with either AD‐eGFP (control) or AD‐sFLT‐1 (preeclampsia model) on embryonic day 10.5 and on embryonic day 15.5. sFLT1 mRNA (A) and eGFP mRNA (B) in liver, plasma, and then we assessed on embryonic day 18.5: (A) sFLT‐1 mRNA (n=6), (B) green fluorescent protein mRNA (n=6) in liver by real time polymerase chain reaction, (C) sFLT‐1 protein (n=7) by ELISA, (D) alanine transaminase levels (n=7) by enzyme activity in plasma, (E) summary graph of noninvasive blood pressure measurements (n=8) (*P<0.01; **P<0.0001), (F) and fetal survival (6 pregnancies in each group). Administration of AD‐sFLT‐1 resulted in sFLT‐1 mRNA expression in the liver and elevated sFLT‐1 protein levels in the plasma, fetal loss and elevated plasma alanine aminotransferase level. We assessed on E15.5, 17.5 and 19.5: vasorin levels in (G) placenta, (H) plasma EVs (n=4 at each time point in each group). vasorin levels exhibit gestational age–dependent increase in placenta and in plasma EVs during normal murine pregnancy. Administration of AD‐sFLT‐1 resulted in decreased vasorin in both placenta and in plasma EV. Data were presented as the mean±SEM. Numerical P values are shown as determined by 2‐tailed, unpaired t test. AD‐eGFP indicates control adenovirus encoding enhanced green fluorescent protein; AD‐sFLT‐1, control adenovirus encoding short FMS‐like tyrosine kinase 1; eGFP, enhanced green fluorescent protein; EV, extracellular vesicle; and sFLT‐1, short FMS‐like tyrosine kinase 1.
Figure 4
Figure 4. Roles of vasorin in the regulation of vascular reactivity by sPE EVs.
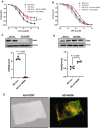
Murine vascular rings were prepared, exposed to AD‐VASN or AD‐shVASN overnight, and then were suspended in wire myograph chambers where they were maximally contracted by treatment with phenylephrine and then treated sequentially with acetylcholine or with SNP as indicated on the x axis. A, Depict the vasodilatory response of aortic rings to acetylcholine, an endothelium‐dependent vasodilator. B, Illustrate the response to SNP, an endothelium‐independent vasodilator. Both acetylcholine and SNP induced vasodilation (n=6 per condition). Western blot analysis confirmed vasorin knockdown (C) using AD‐sh‐VASN and overexpression (D) using AD‐VASN (graph represents n=4 per group). E, Pretreatment with AD‐VASN significantly prevented the loss of acetylcholine‐induced vasorelaxation observed after sPE EV treatment (A). SNP‐induced vasodilation remained unaffected by all treatment groups (B). E, Representative confocal images of vasorin overexpression in the murine aortic rings. Data presented as mean±SEM. Statistics by ANOVA with Tukey's post hoc test. Numerical P values are shown as determined by 2‐tailed, unpaired t test. ACh indicates acetylcholine; AD‐shVASN, adenoviral vectors for vasorin knockdown; AD‐VASN, adenoviral vectors for vasorin overexpression; EV, extracellular vesicle; SNP, sodium nitroprusside; and sPE, severe preeclampsia.
Figure 5
Figure 5. The effects of vasorin knockdown and overexpression on HAEC migration after treatment with sPE EVs.
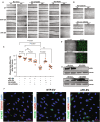
HAEC monolayers were untreated or were treated with AD‐VASN and with AD‐shVASN overnight, then were scratched and scratch wound closure was assessed 24 h later. A, Depicts representative images under each condition of virus/EV treatment. B, Effect of treatment with control (green fluorescent protein) adenovirus. C, Summary graph with statistics (n=7 in each observation). D, Assessment of transfection efficiency by visualizing eGFP fluorescence that is expressed in both AD‐VASN and AD‐shVASN from the bicistronic construct. E, Western blot showing the effect of treatments on vasorin expression. Treatment with sPE EVs, but not with NTP EVs inhibited HAEC migration into the wound. Overexpression of vasorin significantly improved HAEC migration after treatment with sPE‐EV. Knockdown of vasorin expression in HAEC with AD‐shVASN inhibited HAEC migration in the presence of NTP EVs and did not affect the migration of HAEC after sPE EV treatment. HAEC were treated with NTP EVs or with sPE EVs (F) that were labeled with an antibody to TSG101 (EV marker; red) or were labeled with an antibody against vasorin (red) and with the lipophilic dye PKH67 (green). Nuclei were stained with DAPI (blue). Confocal images were collected and maximum intensity projections across four focal planes are shown. Robust uptake of EVs was detected along with uptake of the EV marker and vasorin. Data were presented as the mean±SEM. Numerical P values are shown, ANOVA with Tukey's post hoc test. AD‐shVASN indicates adenoviral vectors for vasorin knockdown; AD‐VASN, adenoviral vectors for vasorin overexpression; eGFP, enhanced green fluorescent protein; EV, extracellular vesicle; HAEC, human aortic endothelial cell; NTP, normotensive pregnancy; and sPE, severe preeclampsia.
Figure 6
Figure 6. The effects of vasorin overexpression or knockdown on gene expression changes in HAECs.
Cells were untreated or were treated with AD‐eGFP, AD‐VASN and with AD‐shVASN overnight, then RNA was isolated and quality control was performed. RNA samples were submitted for library preparation and sequencing, then were analyzed as described in methods. Both overexpressions using AD‐VASN and knockdown using AD‐shVASN of mRNA was significant as compared to AD‐eGFP (A). PCA (B) and hierarchical clustering with heat map (C) revealed that the 4 experimental groups exhibited a high level of separation, and the samples within groups exhibited tight clustering. Venn diagram (D) illustrates the number of genes that were significantly regulated only by vasorin overexpression (magenta), only by vasorin knockdown (blue) or were regulated by both treatments (light magenta), along with volcano plots illustrating the log fold change and log q values and most highly regulated genes (E, F). G and I, top 10 upregulated and top 10 downregulated genes by vasorin overexpression or knockdown, respectively. H, Top 20 (by Z score) genes (including vasorin) that were regulated in both vasorin overexpression and knockdown, but in opposite directions. AD‐eGFP indicates control adenovirus encoding enhanced green fluorescent protein; AD‐shVASN indicates adenoviral vectors for vasorin knockdown; AD‐VASN, adenoviral vectors for vasorin overexpression; HAEC, human aortic endothelial cell; and PCA, principal component analysis.
Figure 7
Figure 7. Pathway and network analysis of genes regulated by vasorin overexpression and knockdown in HAECs.
Comparative gene overrepresentation analysis was performed using lists of significantly (2‐fold change, q<0.05) upregulated and downregulated genes by vasorin overexpression or knockdown in HAECs. Results are shown as dot blots (A, C, E), where pathway activation significance is illustrated with the color scale shown, and the ratio of participating genes relative to the total number of genes in the pathway is noted by the size of the dots, or as gene concept networks (B, D, F), where the node sizes reflect on the ratio of participating genes and the color of the nodes and genes indicate whether they are regulated in any of the 4 permutations of vasorin/shVASN/UP/DOWN. A and B, Top 2 KEGG pathways. C and D, Top two reactomes and panels (E, F) depict results of gene ontology analysis. ECM indicates extracellular matrix; GO, gene ontology; HAEC, human aortic endothelial cell; KEGG, Kyoto Encyclopedia of Genes and Genomes; and MAPK, mitogen‐activated protein kinase.
Figure 8
Figure 8. Characterization of Plex‐derived EVs (Plex‐EV).
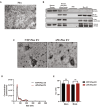
Placentas were freshly collected after delivery and were processed to be cultured as placenta explants, then supernatant was collected 24 h later and EVs were collected as described in methods. A, Gross morphological appearance of explants under phase contrast microscopy. Scale bar: 100 μm. B, Distribution of apolipoprotein A1 plasma protein, PLAP placenta marker, CD63 and tumor suppressor gene 101 (TSG101) EV markers. (C) illustrates transmission electron micrographs of EV from NTP and sPE Plex. Scale bar 100 nm (D) shows particle size distribution of NTP and severe preeclamptic placental EVs. E, Summary graph of particle mean and mode size for NTP and sPE EVs. Data were presented as the mean±SEM. Numerical P values are shown, 2‐tailed, unpaired t test. EV indicates extracellular vesicle; NTP, normotensive pregnancy; PLAP, placenta alkaline phosphatase; Plex, placental explant; Plex‐EV, placenta explant–derived extracellular vesicle; and sPE, severe preeclampsia.
Figure 9
Figure 9. Effect of NTP Plex‐EVs and sPE Plex‐EVs on migration of HAEC in wound healing assays.
Plex‐EVs were prepared from explant cultures of NTP and sPE human placentas as described in Methods, then scratch wounds were created in confluent monolayer HAECs, followed by treatment with either NTP or sPE Plex‐EV and analysis of wound closure 24 h later (A). Wound closure was unaffected by treatment with NTP Plex‐EVs, but was significantly inhibited by treatment with sPE Plex‐EVs (B). Data were presented as the mean±SEM. Numerical P values are shown, ANOVA with Tukey's post hoc test. EV indicates extracellular vesicle; HAEC, human aortic endothelial cell; NTP, normotensive pregnancy; Plex‐EV, placenta explant–derived extracellular vesicle; and sPE, severe preeclampsia.
Figure 10
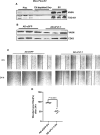
Figure 10. The effect of EV isolated from murine Plex supernatants on HAEC migration in wound healing assays.
EV were isolated from explant cultures prepared from murine placentas from mice injected with AD‐eGFP (control) or AD‐sFLT1 (murine model of preeclampsia). Scratch wound was made in confluent monolayers of HAEC, then they were treated with Plex‐EV and scratch wound closure was assayed 24 h later. A, Distribution of vasorin and the EV marker TSG101 in Plex cultures, in EV‐depleted supernatant, and in EVs. B, Vasorin levels in Plex‐EV, as compared with the EV marker CD63 prepared from AD‐eGFP– and AD‐sFLT‐1–injected mice. C, Representative images of the wound healing assay. D, Graph of summary findings in wound healing assays. Vasorin is highly enriched in Plex‐EVs as compared with Plex culture or EV‐depleted Plex supernatant. Vasorin levels are decreased in AD‐sFLT‐1 Plex‐EVs as compared with AD‐eGFP Plex‐EVs. AD‐sFLT1 Plex‐EV significantly inhibits migration of HAECs. Data were presented as the mean ± SEM. Numerical P values are shown, 2‐tailed, unpaired t test. AD‐eGFP indicates adenovirus encoding green fluorescent protein; AD‐sFLT‐1, control adenovirus encoding short FMS‐like tyrosine kinase 1; EV, extracellular vesicle; HAEC, human aortic endothelial cell; Plex, placenta explant; and Plex‐EV, placenta explant–derived extracellular vesicle; and VASN, vasorin.

Update of

References

    1. Grandi SM, Filion KB, Yoon S, Ayele HT, Doyle CM, Hutcheon JA, Smith GN, Gore GC, Ray JG, Nerenberg K, et al. Cardiovascular disease‐related morbidity and mortality in women with a history of pregnancy complications. Circulation. 2019;139:1069–1079. doi: 10.1161/CIRCULATIONAHA.118.036748 - DOI - PubMed
    1. Duley L. The global impact of pre‐eclampsia and eclampsia. Semin Perinatol. 2009;33:130–137. doi: 10.1053/j.semperi.2009.02.010 - DOI - PubMed
    1. Mendola P, Mumford SL, Mannisto TI, Holston A, Reddy UM, Laughon SK. Controlled direct effects of preeclampsia on neonatal health after accounting for mediation by preterm birth. Epidemiology. 2015;26:17–26. doi: 10.1097/EDE.0000000000000213 - DOI - PMC - PubMed
    1. Stevens W, Shih T, Incerti D, Ton TGN, Lee HC, Peneva D, Macones GA, Sibai BM, Jena AB. Short‐term costs of preeclampsia to the United States health care system. Am J Obstet Gynecol. 2017;217:237–248. doi: 10.1016/j.ajog.2017.04.032 - DOI - PubMed
    1. Qu H, Khalil RA. Vascular mechanisms and molecular targets in hypertensive pregnancy and preeclampsia. Am J Physiol Heart Circ Physiol. 2020;319:H661–H681. doi: 10.1152/ajpheart.00202.2020 - DOI - PMC - PubMed

MeSH terms

LinkOut - more resources