. 2025 Apr;14(7):e039751.
doi: 10.1161/JAHA.124.039751. Epub 2025 Mar 21.

Impact of DNA-Methylation Age Acceleration on Long-Term Mortality Among US Adults With Cardiovascular-Kidney-Metabolic Syndrome

Affiliations

Impact of DNA-Methylation Age Acceleration on Long-Term Mortality Among US Adults With Cardiovascular-Kidney-Metabolic Syndrome

Shuang Wu et al. J Am Heart Assoc. 2025 Apr.

Abstract

Background: The association between DNA methylation age acceleration (DNAmAA) and cardiovascular-kidney-metabolic (CKM) syndrome stages and long-term mortality in the population with CKM syndrome remains unclear.

Methods and results: This cohort study included 1889 participants from the National Health and Nutrition Examination Survey (1999-2002) with CKM stages and DNA methylation age data. DNAmAA was calculated as residuals from the regression of DNA methylation age on chronological age. The primary outcome was all-cause mortality, with cardiovascular and noncardiovascular mortality as secondary outcomes. Proportional odds models assessed the associations between DNAmAAs and CKM stages, and Cox proportional hazards regression models estimated the associations between DNAmAAs and mortality. Significant associations were found between DNAmAAs and advanced CKM stages, particularly for GrimAge2Mort acceleration (GrimAA) (odds ratio [OR], 1.547 [95% CI, 1.316-1.819]). Over an average follow-up of 14 years, 1015 deaths occurred. Each 5-unit increase in GrimAA was associated with a 50% increase in all-cause mortality (95% CI, 1.39-1.63), a 77% increase in cardiovascular mortality (95% CI, 1.46-2.15), and a 42% increase in noncardiovascular mortality (95% CI, 1.27-1.59). With the lowest GrimAA tertile as a reference, the highest GrimAA tertile showed hazard ratios of 1.95 (95% CI, 1.56-2.45) for all-cause mortality, 3.06 (95% CI, 2.13-4.40) for cardiovascular mortality, and 1.65 (95% CI, 1.20-2.29) for noncardiovascular mortality. Mediation analysis indicated that GrimAA mediates the association between various exposures (including physical activity, Healthy Eating Index-2015 score, hemoglobin A1c, etc.) and mortality.

Conclusions: GrimAA may serve as a valuable biomarker for assessing CKM stages and mortality risk in individuals with CKM syndrome, thereby informing personalized management strategies.

Keywords: DNA‐methylation age; DNA‐methylation age acceleration; GrimAge2Mort; cardiovascular‐kidney‐metabolic; mortality.


Conflict of interest statement

None.

Figures
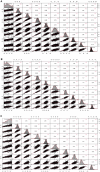
Figure 1
Figure 1. Correlation matrix among chronological age and DNA‐methylation ages.
Entire CKM population (A), CKM stages 1/2 group (B), CKM stages 3/4 group (C). Scatter plots are shown in the lower left corner. Correlation‐significance plots between ages are shown in the upper right corner. The values in the correlation matrix represent Pearson's correlation coefficient. Correlation coefficients (r) are indicated with numeric values, while significance levels (P) are denoted by asterisks (***<0.001). The data distribution map of each individual parameter is shown in the middle. The values given around all the axes are the range of each individual parameter's measured unit values (year). AA indicates age acceleration; and CKM, cardiovascular‐kidney‐metabolic.
Figure 2
Figure 2. Restricted cubic spline analyses for associations between GrimAA and mortality.
All‐cause (A), cardiovascular (B), and noncardiovascular (C) mortality for the entire population with CKM syndrome. All‐cause (D), cardiovascular (E), and noncardiovascular (F) mortality for CKM stages 1/2 group. All‐cause (G), cardiovascular (H), and noncardiovascular (I) mortality for CKM stages 3/4 group. The x axis displays GrimAA, with the unit of measurement in years, and the y axis displays the hazard ratio of GrimAA in relation to mortality outcomes, using GrimAA at 0 as the reference value. CKM indicates cardiovascular‐kidney‐metabolic; GrimAA, GrimAge2Mort acceleration; and HR, hazard ratio.
Figure 3
Figure 3. Kaplan–Meier curve analyses for associations between GrimAA and mortality.
All‐cause (A), cardiovascular (B), and noncardiovascular (C) mortality for the entire population with CKM syndrome. All‐cause (D), cardiovascular (E), and noncardiovascular (F) mortality for CKM stages 1/2 group. All‐cause (G), cardiovascular (H), and noncardiovascular (I) mortality for CKM stages 3/4 group. CKM indicates cardiovascular‐kidney‐metabolic; and GrimAA, GrimAge2Mort acceleration.
Figure 4
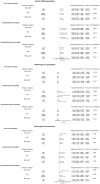
Figure 4. Forest plot of subgroup analyses for associations between GrimAA and mortality outcomes categorized by age, sex, and BMI.
BMI indicates body mass index; CKM, cardiovascular‐kidney‐metabolic; GrimAA, GrimAge2Mort acceleration; and HR, hazard ratio.
Figure 5
Figure 5. Mediation effects of GrimAA on the relationships between exposures with all‐cause mortality(A), cardiovascular death (B), and noncardiovascular death (C) in the entire population with CKM syndrome.
eGFR indicates estimated glomerular filtration rate; and GrimAA, GrimAge2Mort acceleration.

References

    1. Ndumele CE, Neeland IJ, Tuttle KR, Chow SL, Mathew RO, Khan SS, Coresh J, Baker‐Smith CM, Carnethon MR, Després JP, et al. A synopsis of the evidence for the science and clinical Management of cardiovascular‐kidney‐metabolic (CKM) syndrome: a scientific statement from the American Heart Association. Circulation. 2023;148:1636–1664. doi: 10.1161/CIR.0000000000001186 - DOI - PubMed
    1. Ndumele CE, Rangaswami J, Chow SL, Neeland IJ, Tuttle KR, Khan SS, Coresh J, Mathew RO, Baker‐Smith CM, Carnethon MR, et al. Cardiovascular‐kidney‐metabolic health: a presidential advisory from the American Heart Association. Circulation. 2023;148:1606–1635. doi: 10.1161/CIR.0000000000001184 - DOI - PubMed
    1. Noroozi R, Ghafouri‐Fard S, Pisarek A, Rudnicka J, Spólnicka M, Branicki W, Taheri M, Pośpiech E. DNA methylation‐based age clocks: from age prediction to age reversion. Ageing Res Rev. 2021;68:101314. doi: 10.1016/j.arr.2021.101314 - DOI - PubMed
    1. Horvath S, Raj K. DNA methylation‐based biomarkers and the epigenetic clock theory of ageing. Nat Rev Genet. 2018;19:371–384. doi: 10.1038/s41576-018-0004-3 - DOI - PubMed
    1. Bell CG, Lowe R, Adams PD, Baccarelli AA, Beck S, Bell JT, Christensen BC, Gladyshev VN. DNA methylation aging clocks: challenges and recommendations. Genome Biol. 2019;20:249. doi: 10.1186/s13059-019-1824-y - DOI - PMC - PubMed

MeSH terms

LinkOut - more resources