. 2025 Mar 21;16(1):2810.
doi: 10.1038/s41467-025-57641-9.

Dependence of mitochondrial calcium signalling and dynamics on the disaggregase, CLPB

Affiliations

Dependence of mitochondrial calcium signalling and dynamics on the disaggregase, CLPB

Donato D'Angelo et al. Nat Commun. .

Abstract

Cells utilize protein disaggregases to avoid abnormal protein aggregation that causes many diseases. Among these, caseinolytic peptidase B protein homolog (CLPB) is localized in the mitochondrial intermembrane space and linked to human disease. Upon CLPB loss, MICU1 and MICU2, regulators of the mitochondrial calcium uniporter complex (mtCU), and OPA1, a main mediator of mitochondrial fusion, become insoluble but the functional outcome remains unclear. In this work we demonstrate that CLPB is required to maintain mitochondrial calcium signalling and fusion dynamics. CLPB loss results in altered mtCU composition, interfering with mitochondrial calcium uptake independently of cytosolic calcium and mitochondrial membrane potential. Additionally, OPA1 decreases, and aggregation occurs, accompanied by mitochondrial fragmentation. Disease-associated mutations in the CLPB gene present in skin fibroblasts from patients also display mitochondrial calcium and structural changes. Thus, mtCU and fusion activity are dependent on CLPB, and their impairments might contribute to the disease caused by CLPB variants.


Conflict of interest statement

Competing interests: The authors declare no competing interests.

Figures

Fig. 1
Fig. 1. The lack of CLPB modifies the abundance and the solubility of the mtCU components.
a Scheme depicting the assembly of the mtCU (MCU, EMRE, MICU1, MICU2). Graphics Created in BioRender. Cartes Saavedra, B. (2025) https://BioRender.com/v91z573. b, c Representative Western blot and quantification of the mtCU components and CLPB obtained from whole cell lysates of wild type (WT) and CLPB knockout (KO) HAP1 cells. GRP75 was used as a loading control. d, e Representative Western blot and quantification of MICU1 and MICU2 dimers from WT and CLPB KO HAP1 cell lysates. TOM20 was used as a loading control. In c and e data represent the mean ± SEM. n = 5 and 4 for WT and CLPB KO, respectively. For analysis, an unpaired Student T-test was used. *p ≤ 0.05 and **p ≤ 0.01. HEK MICU1 KO cells in panels b and d were used as a control for MICU1 loss. f, g Representative Western blot and quantification of the mtCU components and CLPB in CLPB-silenced HeLa cells for 96 h. GRP75 was used as a loading control. Data are presented as mean ± SEM. n = 3 replicates for each condition. For analysis, an unpaired Student T-test was used. *p ≤ 0.05; **p ≤ 0.01; ***p ≤ 0.001. h, i Representative Western blot and quantification of the mtCU components and CLPB from cell lysates of CLPB-overexpressed HeLa cells for 24 or 48 h. GRP75 was used as a loading control. Data are presented as mean ± SEM. n = 3 replicates for each condition. For analysis, one-way ANOVA was used with post hoc Bonferroni tests for each sample. *p ≤ 0.05 and **p ≤ 0.01. j Aggregation assay from isolated mitochondria of CLPB-silenced HeLa cells for 96 h. Mitochondrial isolation was performed and the total proteins (T), along with the soluble (S) and insoluble fractions (P), were purified and analyzed via Western blotting. PDH served as a negative control. n = 2. k Representative Western blot of the mtCU components, CLPB and the AAA+ proteases YME1L and AFG3L2 subjected to CLPB, YME1L or AFG3L2 silencing in HeLa cells after 96 h. GRP75 was used as a loading control. n = 3. Source data are provided as a Source Data file.
Fig. 2
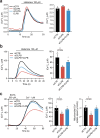
Fig. 2. The absence of CLPB reduces mitochondrial Ca2+ signaling, which is reestablished by CLPB rescue.
a, b Average traces of cytosolic Ca2+ concentration ([Ca2+]c) and mitochondrial matrix Ca2+ concentration ([Ca2+]m) during a Store Operated Ca2+ Entry (SOCE) protocol in WT), CLPB knockout and rescued cells. All the cells co-expressed the mitochondrial Ca2+ sensor mtGCaMP6f together with either the empty vector (WT and CLPB KO cells) or CLPB WT expressing vector (rescued cells) for 48 h. Cells were loaded with 2 μM Fura-2/AM and were stimulated with 2 μM Tg to deplete the ER Ca2+ store in a Ca2+-free medium, followed by the readdition of 1 mM of CaCl2 to induce SOCE. The inset in b shows the amplification of the [Ca2+]m during Ca2+ depletion of the ER. c Quantification of [Ca2+]c and [Ca2+]m rise in response to the ER Ca2+ store depletion. d Quantification of cytoplasmic and mitochondrial Ca2+ peak in response to Ca2+ readdition. The values in c and d represent the Area under the Curve (AUC) calculated from 30 to 150 s for c and from 370 to 570 s for d. Data are presented as mean ± SEM. WT cells, n = 127 cells; CLPB KO cells, n = 78 cells; CLPB rescued cells, n = 68 cells, from 12 independent experiments. For analysis, one-way ANOVA was used with post hoc Bonferroni tests. *p ≤ 0.05; ***p ≤ 0.001. Source data are provided as a Source Data file.
Fig. 3
Fig. 3. CLPB silencing affects mitochondrial Ca2+ uptake but not cytosolic Ca2+ homeostasis in HeLa cells.
a, b Cytosolic Ca2+ concentration ([Ca2+]c) and mitochondrial matrix Ca2+ concentration ([Ca2+]m) measurements, respectively, in intact HeLa cells transfected with the indicated siRNAs and constructs for 96 h together with cytosolic and mitochondrial aequorin transfected 48 h before Ca2+ measurements and challenged with maximal histamine stimulation. Left panel: representative traces; right panel: bar diagram representing the mean [Ca2+] peak upon stimulation. n = 3 for each condition for [Ca2+]c measurements. siCTR, n = 3; siCLPB, n = 3; siCLPB+CLPB n = 4 for [Ca2+]m measurements. c [Ca2+]m measurements in permeabilized HeLa cells transfected with the indicated siRNAs and constructs for 96 h together with mitochondrial targeted aequorin transfected 48 h before Ca2+ measurements and perfused with 1 μM Ca2+. Left panel: representative traces; middle panel: bar diagram representing the mean [Ca2+]m peak upon stimulation; right panel: bar diagram representing the mean [Ca2+]m speed. siCTR, n = 4; siCLPB, n = 5; siCLPB+CLPB, n = 4. In all panels, data are presented as mean ± SEM. For data analysis, one-way ANOVA was used with post hoc Bonferroni tests for each sample. *p ≤ 0.05. Source data are provided as a Source Data file.
Fig. 4
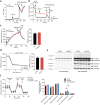
Fig. 4. CLPB loss does not affect mitochondrial membrane potential and OXPHOS protein content but reduces the mitochondrial Ca2+ clearance.
a, b Simultaneous measurements of Ca2+ clearance and mitochondrial membrane potential (ΔΨm) in  WT and CLPB KO HAP1 permeabilized cells following consecutive additions of 3 μM and 20 μM CaCl2. Two μM FCCP + 5 μM Oligomycin was added to induce complete mitochondrial membrane depolarization. n = 15 and 14 technical replicates for WT and CLPB KO, respectively. c ΔΨm was tested in intact WT and CLPB KO cells by measuring tetramethyl rhodamine methyl ester (TMRM) uptake (25 nM). Five μM of Oligomycin was used to induce maximal TMRM uptake, while 5 μM FCCP to fully discharge it. For quantification TMRM fluorescence was obtained during the 30-s period prior to the addition of oligomycin. Data are presented as the mean ± SEM from 9 experiments for each condition. For analysis, an unpaired Student T-test was used. d HeLa cells silenced for 96 h for CLPB were loaded with TMRM and TMRM fluorescence measurements were performed. Where indicated 10 μM carbonyl cyanide 3-chlorophenylhydrazone (CCCP) was added. a.u., arbitrary units. n = 52 and n = 49 cells for siCTR and siCLPB respectively. Data are presented as mean ± SEM. e Representative Western blot of the (oxidative phosphorylation) OXPHOS complexes in control and CLPB-silenced HeLa cells for 96 h. Whole cell lysates were subjected to Western blotting analysis with a cocktail of primary antibodies for the specific components of the OXPHOS complexes. Left panel: low exposure image. Right panel: high exposure image. n = 3. f Oxygen consumption rate (OCR) in HeLa cells transfected with the indicated siRNAs and constructs for 96 h (left panel). Components of OCR accounting for basal, ATP-linked, and maximal respiration, spare capacity, non-mitochondrial OCR and proton leak are quantified in the right panel. Data are normalized on mean Calcein fluorescence. Data are presented as mean ± SEM. n = 15 replicates for each condition. For analysis, one-way ANOVA was used with post hoc Bonferroni tests for each sample. *p ≤ 0.05; **p ≤ 0.01. Source data are provided as a Source Data file.
Fig. 5
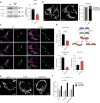
Fig. 5. Loss of CLPB causes mitochondrial fragmentation and mitochondrial fusion instability in HAP1 and HeLa cells.
a Representative Western blot and quantification of OPA1 under reducing conditions from  WT and CLPB KO HAP1 cells. The relative changes in the OPA1 abundance were normalized by TOM20 levels. Data are presented as mean ± SEM. n = 7 and 6 for WT and CLPB KO cells, respectively. For data analysis, an unpaired Student T-test was used. ***p ≤ 0.001. b Representative confocal images of mitochondrial morphology in WT and CLPB KO HAP1 cells stained with 20 nM tetramethyl rhodamine methyl ester (TMRM). The percentage of elongated, intermediate and fragmented mitochondria was quantified and plotted for each condition. n = 20 cells. c Representative confocal images of mitochondrial network continuity and mtDendra2 spreading before photoactivation (PA), 50 s and 450 s after PA. d Mitochondrial fusion events frequency, left upper panel. Mitochondrial fusion classification scheme, right upper panel. Complete mitochondrial fusion events, left bottom panel. Kiss-and-run fusion events, right bottom panel. Data are presented as mean ± SEM. n = 20 cells for WT and CLPB KO. For data analysis, unpaired T-test was used for each pair of data. *p ≤ 0.05; ***p ≤ 0.001. Graphics created in BioRender. Sanchez Vazquez, V. (2025) https://BioRender.com/y87b112. e Representative images of mitochondrial morphology in HeLa cells transfected for 96 h with the indicated siRNAs and constructs together with the mitochondrially targeted fluorescent protein 4mtEMERALD. Cells were fixed and mitochondrial morphology was analyzed. Scale bar = 10 μm. f Quantification of the percentage of elongated, intermediate, and fragmented mitochondria of the experiment as in e. Data are presented as mean ± SEM. n = 30 cells for siCTR, siCLPB and siCLPB+CLPB. For data analysis, one-way ANOVA was used with post hoc Bonferroni tests for each sample. *p ≤ 0.05; ns: non-significant. Source data are provided as a Source Data file.
Fig. 6
Fig. 6. mtCU protein expression and mitochondrial Ca2+ dynamics in CLPB mutated skin fibroblasts carrying mutations in the CLPB gene.
a Whole cell lysates extracted from skin fibroblasts from patients carrying mutations in the CLPB gene were subjected to Western blotting analysis for the different mtCU complex components. GRP75 was used as a loading control. n= 3. b Aggregation assay from isolated mitochondria from skin fibroblasts from patients carrying mutations in the CLPB gene. After mitochondrial isolation, the total proteins (T), along with the soluble (S) and insoluble fractions (P), were purified and analyzed via Western blotting with the indicated antibodies. PDH and TOM20 served as negative controls. n= 2. c [Ca2+]m measurements in intact skin fibroblasts of patients carrying the indicated mutations transfected with mitochondrial targeted aequorin for 48 h and challenged with maximal histamine stimulation. Left panel: representative traces; right panel: bar diagram representing the mean [Ca2+]m peak upon stimulation ± SEM. n= 6 replicates for each condition. d Resting [Ca2+]m in skin fibroblasts from patients carrying mutations in the CLPB gene, evaluated through ratiometric imaging (ex490/410) of the mitochondrial-targeted GCaMP6f transfected 48 h before the measurements. Data are presented as mean ± SEM. CTR, n= 16; CLPB A[591]V, n= 17; CLPB P[427]L, n= 16; CLPB R[561]W, n= 12. For data analysis, one-way ANOVA was used with post hoc Bonferroni tests for each sample. *p 0.05; **p 0.01. Source data are provided as a Source Data file.
Fig. 7
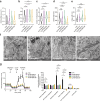
Fig. 7. Mitochondrial cristae morphology and mitochondrial respiration in skin fibroblasts carrying mutations in the CLPB gene.
ae Quantification of mitochondrial area a, circularity b, cristae number c, length d, and width e. Data are presented as mean ± SEM. n = 30 cells analyzed per condition. For data analysis, one-way ANOVA was used with post hoc Bonferroni tests for each sample. *p ≤ 0.05; ***p ≤ 0.001. f Representative electron microscopy images of mitochondria from control and skin fibroblasts from patients carrying mutations in the CLPB gene. g Oxygen consumption rate (OCR) in skin fibroblasts from patients with mutations in the CLPB gene (left panel). Components of OCR accounting for basal, ATP-linked, and maximal respiration, spare capacity, non-mitochondrial OCR and proton leak are quantified in panel in the right panel. Data are normalized on mean Calcein fluorescence. Data are presented as mean ± SEM. n = 10 replicates for each condition. For data analysis, one-way ANOVA was used with post hoc Bonferroni tests for each sample. *p ≤ 0.05; **p ≤ 0.01. Source data are provided as a Source Data file.
Fig. 8
Fig. 8. Overexpression of patients mutated CLPB in HeLa cells and HAP1 CLPB KO recapitulates the phenotype of the patients carrying CLPB mutations.
a Representative Western blots of the mtCU components from whole cell lysates of HeLa cells transfected for 48 h with the indicated constructs. GRP75 was used as a loading control. n = 3. b Aggregation assay from isolated mitochondria from HeLa cells transfected for 48 h with the indicated constructs. PDH and TOM20 served as negative controls. n = 2. c, d Mitochondrial matrix [Ca2+] ([Ca2+]m) peak and resting [Ca2+]m, respectively in HeLa cells expressing the indicated constructs for 48 h. The ratiometric imaging (ex490/410) was performed using the mitochondrial-targeted GCaMP6f. Data are presented as mean ± SEM. n = 10 cells for all the conditions. For analysis, one-way ANOVA was used with post hoc Bonferroni tests. **p ≤ 0.01; ***p ≤ 0.001. e Resting [Ca2+]m in HAP1 CLPB KO cells and CLPB KO cells expressing the CLPB WT or the CLPB mutants for 48 h. The resting [Ca2+]m was obtained by Fluorescence Lifetime imaging using the mitochondrial-targeted sensor mtRCaMP. Data are presented as mean ± SEM. CLPB KO, n = 56 cells; CLPB WT, n = 75 cells; CLPB A[591]V, n = 27 cells; CLPB P[427]L, n = 74 cells; CLPB R[561]W, n = 80 cells, from 3 experiments. For analysis, one-way ANOVA was used with post hoc Bonferroni tests for each sample. *p ≤ 0.05; **p ≤ 0.01. f, g Average traces for cytosolic Ca2+ concentration ([Ca2+]c) and [Ca2+]m signaling in CLPB KO cells and CLPB KO cells expressing the indicated constructs for 48 h. The cytoplasmic and mitochondrial Ca2+ increases were induced by adding 1 mM CaCl2 and previously stimulated with 2 μM Tg. h, i Quantification of the [Ca2+]c and [Ca2+]m responses from f and g, respectively. Data are presented as mean ± SEM of the AUC from 370 to 570 s. CLPB KO, n = 27 cells; CLPB WT, n = 16 cells; CLPB A[591]V, n = 11 cells; CLPB P[427]L, n = 30 cells; CLPB R[561]W, n = 24 cells, from at least 5 experiments. For analysis, one-way ANOVA was used with post hoc Bonferroni tests. *p ≤ 0.05; **p ≤ 0.01. Source data are provided as a Source Data file.

References

    1. Chuang, E., Hori, A. M., Hesketh, C. D. & Shorter, J. Amyloid assembly and disassembly. J Cell Sci13, jcs189928 (2018). - PMC - PubMed
    1. Eisele, Y. S. et al. Targeting protein aggregation for the treatment of degenerative diseases. Nat. Rev. Drug Discov.14, 759–780 (2015). - PMC - PubMed
    1. Cupo, R. R. & Shorter, J. Skd3 (human ClpB) is a potent mitochondrial protein disaggregase that is inactivated by 3-methylglutaconic aciduria-linked mutations. Elife9, e55279 (2020). - PMC - PubMed
    1. Louros, N., Schymkowitz, J. & Rousseau, F. Mechanisms and pathology of protein misfolding and aggregation. Nat. Rev. Mol. Cell Biol.24, 912–933 (2023). - PubMed
    1. Capo-Chichi, J. M. et al. Disruption of CLPB is associated with congenital microcephaly, severe encephalopathy and 3-methylglutaconic aciduria. J. Med Genet52, 303–311 (2015). - PubMed

MeSH terms

LinkOut - more resources