. 2025 Mar 21;16(1):2781.
doi: 10.1038/s41467-025-58122-9.

Recapitulation of endochondral ossification by hPSC-derived SOX9+ sclerotomal progenitors

Affiliations

Recapitulation of endochondral ossification by hPSC-derived SOX9+ sclerotomal progenitors

Jingfei Xiong et al. Nat Commun. .

Abstract

Endochondral ossification generates most of the load-bearing bones, recapitulating it in human cells remains a challenge. Here, we report generation of SOX9+ sclerotomal progenitors (scl-progenitors), a mesenchymal precursor at the pre-condensation stage, from human pluripotent stem cells and development of osteochondral induction methods for these cells. Upon lineage-specific induction, SOX9+ scl-progenitors have not only generated articular cartilage but have also undergone spontaneous condensation, cartilaginous anlagen formation, chondrocyte hypertrophy, vascular invasion, and finally bone formation with stroma, thereby recapitulating key stages during endochondral ossification. Moreover, self-organized growth plate-like structures have also been induced using SOX9+ scl-progenitor-derived fusion constructs with chondro- and osteo-spheroids, exhibiting molecular and cellular similarities to the primary growth plates. Furthermore, we have identified ITGA9 as a specific surface marker for reporter-independent isolation of SOX9+ scl-progenitors and established a culture system to support their expansion. Our work highlights SOX9+ scl-progenitors as a promising tool for modeling human skeletal development and bone/cartilage bioengineering.


Conflict of interest statement

Competing interests: Patents for isolation, characterization, and expansion of SOX9+ Scl-progenitors have been filed (application nos. 202211228107.2, 202211220041.2 and 202310160109.0). For all patents, the patent applicant: Sichuan University; name of inventors: Zhonghan Li and Jingfei Xiong; status of application: 202211228107.2 and 202310160109.0 have been granted. All other authors declare no competing interests.

Figures

Fig. 1
Fig. 1. Derivation of expandable SOX9+ sclerotomal progenitors from hPSCs.
A The strategy for stepwise induction of SOX9+ sclerotomal progenitors (scl-progenitors) (top), mimicking the developmental process (bottom). B RT-qPCR confirmed sclerotome-specific gene expression in SOX9+ Scl-progenitors. Error bars: mean ± sd), n = 6 samples. ACTB (beta-actin) was used as the housekeeping control. ND: not detected in 40 cycles. C SOX9 and TWIST1 immunostaining in SOX9+ scl-progenitors at day 4. Nuclear staining: DAPI. Scale bars: 200 μm. D Western blotting on day-4 SOX9+ scl-progenitors confirmed expression of SOX9 and TWIST1. E Flow cytometry analysis revealed near uniform derivation of SOX9+ scl-progenitors. Traditional and optimized methods were compared. Undifferentiated SOX9-tdTomato hPSCs served the negative control. F The multi-batch analysis confirmed the consistent performance of the optimized differentiation method. Independent batches were analyzed by flow cytometry. The box (extending from 25th to 75th percentiles with median in the middle) and whiskers (minima to maxima) represent data from independent batches of differentiation (n = 9 for optimized method; n = 10 for traditional method). Statistics: Student’s t-test (two-tailed), by SPSS v26.0. ***p < 0.001 (p = 0.0002). G Experimental strategy for expanding SOX9+ scl-progenitors in vitro. H Continuous expansion of SOX9+ scl-progenitors for ~2 months in the defined medium. I SOX9+ scl-progenitors exhibited further maturation during in vitro expansion. RT-qPCR analysis showed increased expression of sclerotome-specific genes in the expanded cells. Error bars: mean ± sd), n = 6 samples. N.D., not detected in 40 cycles. Statistics: Student t-test (two-tailed), by SPSS v26.0. *p < 0.05 (p = 0.0127), **p < 0.01 (p = 0.0048 for PAX1 and p = 0.0024 for TWIST1); ****p < 0.0001 (p = 0.000038). J Immunostaining of SOX9 and TWIST1 confirmed the maintenance of cell identity in expanded scl-progenitors. Nuclear staining: DAPI. Scale bars: 200μm. K, L Flow cytometry analysis confirmed the maintenance of SOX9+ scl-progenitor’s identity at different passages. K The percentage of SOX9+ cells at different passages. L Repeatability test of three independent samples of expanded scl-progenitors at different passages by flow cytometry. M The expansion medium was specific for supporting SOX9+ scl-progenitors. SOX9+ scl-progenitor and SOX9- cells were sorted and compared in the expansion medium for multiple passages. Source data are provided as a Source Data file.
Fig. 2
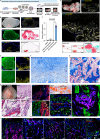
Fig. 2. Recapitulation of endochondral ossification by SOX9+ scl-progenitors.
A Experimental strategy to recapitulate endochondral ossification using SOX9+ scl-progenitors. B 4-week grafts showed hypertrophic chondrocytes and initial calcification. i Graft overview with calcified hypertrophic region outlined (black dotted line). ii human origin confirmed by anti-KU80. iii-iv cartilaginous tissues visualized by Safranin O and COL II staining. v hypertrophy indicated by COL X immunostaining. vi calcified region marked by Alizarin red. Scale bars: 1 mm. C RT-qPCR indicated that the day-12 early chondrocytes lacked COL10A1 expression. Error bars: mean ± sd (n = 6 samples). Statistics: Student’s t-test (two-tailed), one-way ANOVA (SPSS v26.0). NS, not significant (p = 0.5715). ****p < 0.0001 (p = 0.00000000020). D 8-week grafts showed vascular invasion and multiple ossification centers. i blood vessel network on graft surface. ii-iii anti-KU80 confirmed human origin. iv multiple calcified regions and ossification centers revealed by Alizarin red. v Safranin O staining revealed multi-directional growth-plate-like tissues surrounding ossification centers. Scale bars: 1 mm (i, ii and iv), 500 μm (iii, v). E Representative growth plate-like tissues: anti-COL II (proliferating zone), anti-COL X (hypertrophic zone). Scale bars: 200 μm. F Columnar chondrocytes in growth plate-like tissues (8-week grafts). RZ: resting zone; PZ: proliferating zone; HZ: hypertrophic zone. Scale bars: 100 μm. G Masson’s trichrome staining revealed Bone-like tissues (8-week grafts). Scale bars: 200 μm. H Complete bone with a medullary cavity at 16 weeks. i bone formation and vascularization. ii-iv H&E staining showed bone marrow cavity formation with adipocytes, stromal, and hematopoietic cells. TB, trabecular bone. v-vi anti-COL I and anti-human VIM confirmed bone formation and its human origin. Arrowheads, COL I, and human VIM colocalization. vii-ix adipocytes were stained by Oil red and anti-SCD1. Anti-KU80 confirmed the human origin of some adipocytes. x host hematopoietic cells stained by anti-mouse CD45. Scale bars: 1 mm (i), 500 μm (ii, v), 50 μm (iii, vii-x), 20 μm (iv, vi). I Vascular architecture and mesenchymal stroma in 16-week grafts. i anti-COL I, and anti-EMCN revealed trabecular bone intertwined by sinusoidal vessels. ii host mesenchymal stromal cells verified by anti-LEPR. iii-iv niche cytokines were stained by anti-CXCL12 and anti-SCF. v EMCN+vascular endothelial cells enfolded by KU80+ human cells. Scale bars: 100 μm. Source data are provided as a Source Data file.
Fig. 3
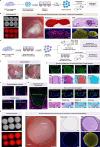
Fig. 3. Generating osteogenic and chondrogenic spheroids by SOX9+ scl-progenitors.
A Experimental procedure to construct osteogenic spheroids. The osteogenesis-committed early chondrocytes (micromass-derived) were centrifuged for spheroid formation followed by being cultured in CI medium for 7 days to further condense. B The osteo-spheroids formed calcified tissues at 4 weeks under kidney capsule, as revealed by Alizarin red, COL II, and COL X staining. Scale bars: 500 μm (before transplantation), 100 μm (post transplantation). C Experimental procedure to construct chondrogenic spheroids. The SOX9+ scl-progenitors were centrifuged for spheroid formation followed by being cultured in CI medium for chondroprogenitor (Cp) differentiation. D Representative images of the repaired proximal tibial plateau compared to the sham control. Scale bars: 500 μm. E Chondroprogenitors (Cps, day 4) could efficiently generate articular cartilage in vivo. H&E: visualization of tissue morphology. Toluidine blue staining, Alcian blue, and Safranin O were used to detect cartilaginous extracellular matrix (ECM). COL II and ACAN: chondrocyte markers. Human vimentin (VIM): human origin marker. PRG4 marked the superficial layer of the articular cartilage. No typical cartilage tissues were formed in the sham control. For each group, n = 3 mice. Scale bars: 100 μm. F No hypertrophy or ossification was detected in Cp-derived cartilaginous tissues. COL X: hypertrophic chondrocyte marker. COL I: the marker for fibrous and bone tissues. The mouse femur was used as the positive control. Scale bars: 100 μm. G Transplanted Cps did not contribute to the subchondral bone. COL I: the marker for fibrous and bone tissues. human VIMENTIN: the marker for transplanted Cps. Scale bars: 200μm. (H) The chondro-spheroids alone only formed cartilaginous tissues under kidney capsule. Samples were analyzed at 4 weeks post-transplantation. The histological evaluations were conducted the same as (B). Scale bars: 500 μm (upper), 100 μm (lower).
Fig. 4
Fig. 4. Generating polarized growth plate-like structures by SOX9+ scl-progenitors-derived osteochondral fusions.
A The experimental procedure to construct osteochondral fusion using SOX9+ scl-progenitor-derived osteo-spheroids (containing osteogenesis-committed early chondrocytes) and chondro-spheroids (containing day-14 chondroprogenitors. Scale bars: 500 μm. B The osteochondral fusions generated polarized growth plate-like tissues with unidirectional proliferating chondrocyte columns. Alizarin red: calcified region. Masson’s trichrome and Safranin O showed the overall morphology and the growth plate-like regions. The dotted line: proliferating zone. KU80 marked human cells. RZ, resting zone. PZ, proliferating zone. HZ, hypertrophic zone. Scale bars: 100μm. C Consistent formation of polarized growth plate-like tissues in the osteochondral fusion grafts. The width of the proliferating zones was measured and compared with transplants with chondro- and osteo-spheroids as controls. Error bars (mean ± sd) represented data from five independent transplants (two sections per transplant). Scale bars: 100 μm. Statistics: Student’s t-test (two-tailed), by SPSS v26.0. **p < 0.01 (p = 0.0011), ****p < 0.0001 (p = 0.00000025). D, E Similar expression of regional markers between the osteochondral fusion (E) with primary growth plate tissues from mouse femur at PN9 (D). COL II, pan-chondrocyte marker. IHH, prehypertrophic chondrocyte marker. COLX, hypertrophic chondrocyte marker. SP7, osteoblast, and bone progenitor marker. EMCN, endothelial marker. Scale bars: 100 μm. Source data are provided as a Source Data file.
Fig. 5
Fig. 5. Characterization of polarized growth plate-like structures.
A Anti-COL II and anti-PCNA confirmed proliferative cells in growth plate-like structures of osteochondral fusions, resembling PN9 mouse femur. Scale bars: 100 μm. BE Osteochondral fusions mediated longitudinal bone growth. Grafts were harvested weekly for 4 weeks for analysis. B graft overview. Scale bar: 500 μm. C tissue growth quantification. Each dot represents a single fusion graft (n = 6 for week-0, n = 3 for each time point). D increasing aspect ratios indicated longitudinal elongation. Error bars: mean ± sd. Statistics: Student t-test (two-tailed). p = 0.0190 (week-4 vs. week-2); p = 0.0031 (week-4 vs. week-1); p = 0.00000081 (week-4 vs. week-0). E H&E staining. Scale bar: 200 μm. F, G Anti-COL II confirmed PZ (proliferative chondrocyte zone) elongation. F PZs marked by dotted lines (flattened cells stained by anti-COL II). Nuclear staining: DAPI. Scale bars: 200 μm. G quantitative analysis of PZ elongation. Data collected from independent samples (n = 6 for week-0, n = 3 for each time point). Statistics: Student t-test (two-tailed), *p < 0.05, ***p < 0.001, ****p < 0.0001. p = 0.0337 (week-4 vs. week-3); p = 0.0007 (week-4 vs. week-2); p = 0.000085 (week-4 vs. week-1); p = 0.0000010 (week-4 vs. week-0). H, I Mechanical testing by nanoindentation. H 4-week grafts coronally cryosectioned, fixed, and polished with indents made on resting/proliferative zone (R/PZ), hypertrophic zone (HZ), and spongiosa. I elastic modulus, and hardness calculated using the Oliver-Pharr method. Error bars: mean ± sd, n = 6 indents for each zone. Statistics: Student t-test (two-tailed) and One-way ANOVA, **p < 0.01, ****p < 0.0001. **p = 0.0061, ****p = 0.0000045 (Young’s modulus); **p = 0.0023, ****p = 0.000059 (hardness). J ScRNA-seq identified human skeletal and host cells in 4-week grafts. EpiphyChon, epiphyseal chondrocytes. ProlifChon, proliferative chondrocytes. PrehyperChon, prehypertrophic chondrocytes. HyperChon, hypertrophic chondrocytes. OB, osteoblast/progenitor cells. PeriChon, perichondral cells. EndoCell, endothelial cells. HematoCell, hematopoietic cells. StromCell, stromal cells. K Marker gene expression in each cluster by dot plot. (L-O) Integration analysis with human embryonic long bones (PCW8.0). L UMAP visualization of integrated dataset. M overlaps between osteochondral fusions and embryonic long bones across cell types. N similar gene expression profiles between fusion grafts and embryonic long bones. O comparable expression of endochondral ossification lineage-specific genes. Source data are provided as a Source Data file.
Fig. 6
Fig. 6. ITGA9 enabled reporter-independent isolation of SOX9+ scl-progenitors.
A RNA-seq analysis revealed multiple surface markers enriched in SOX9+ scl-progenitors. Transcriptomic analysis was done by comparing SOX9+ scl-progenitors vs SOX9- cells sorted from Day-6 sclerotomal cells from the traditional method (n = 3 for each group). Statistics: Exact test based on the negative binomial distribution (two-sided) by edgeR. B Confirmation of differential gene expression between SOX9+ scl-progenitors and SOX9- cells by RT-qPCR. For RT-qPCR, error bars (mean ± sd) represented data from six biological replicates; for RNA-seq, error bars (mean ± sd) represented data from three biological replicates. C Confirmation of SOX9 and ITGA9 co-expression in differentiated sclerotomal cells by flow cytometry. Isotype antibody served as the control. The proportion of SOX9+ cells among the ITGA9+ population was shown on the right, which was gated according to undifferentiated hPSCs. D Confirmation of SOX9 and ITGA9 co-expression by immunostaining. ITGA9+ cells were sorted and stained with anti-SOX9. Scale bars: 50 μm. E Sclerotome-specific genes were highly enriched in ITGA9+ cells. Error bars:mean ± sd, n = 6 samples. F ITGA9+ cells retained osteochondral competence. Cell differentiation was induced the same as in Supplementary Fig. 2G. Scale bars: 200 μm (Alizarin red); 100 μm (spheroids). G Negative immunostaining of hypertrophic and osteogenic markers indicated no ossification. COL X: hypertrophic chondrocyte marker. COL I: the marker for fibrous and bone tissues. The mouse femur was used as the positive control. Scale bars: 100 μm. H, I Sclerotome-specific genes were also enriched in ITGA9+ cells derived by the current method. Error bars:mean ± sd, n = 6 samples. ACTB served as the housekeeping control. Statistics: Student t-test (two-tailed), by SPSS v26.0. ***p < 0.001, ****p < 0.0001. p = 0.0000021 (ITGA9); p = 0.00000045 (SOX9); p = 0.0000086 (PAX1); p = 0.0002 (PAX9); p = 0.0000084 (TWIST1); p = 0.0000062 (NKX3-2). Source data are provided as a Source Data file.
Fig. 7
Fig. 7. Summary of the key features for our approach in modeling human endochondral ossification.
Illustrative summary highlighting key features of this study.

References

    1. Salhotra, A., Shah, H. N., Levi, B. & Longaker, M. T. Mechanisms of bone development and repair. Nat. Rev. Mol. Cell Biol.21, 696–711 (2020). - PMC - PubMed
    1. Cui, A. et al. Global, regional prevalence, incidence and risk factors of knee osteoarthritis in population-based studies. EClinicalMedicine29–30, 100587 (2020). - PMC - PubMed
    1. Makris, E. A., Gomoll, A. H., Malizos, K. N., Hu, J. C. & Athanasiou, K. A. Repair and tissue engineering techniques for articular cartilage. Nat. Rev. Rheumatol.11, 21–34 (2015). - PMC - PubMed
    1. Latourte, A., Kloppenburg, M. & Richette, P. Emerging pharmaceutical therapies for osteoarthritis. Nat. Rev. Rheumatol.16, 673–688 (2020). - PubMed
    1. Katz, J. N., Arant, K. R. & Loeser, R. F. Diagnosis and treatment of hip and knee osteoarthritis: a review. JAMA325, 568–578 (2021). - PMC - PubMed

MeSH terms

Substances

LinkOut - more resources