. 2025 Mar 21;16(1):2785.
doi: 10.1038/s41467-025-58044-6.

Comprehensive promotion of iPSC-CM maturation by integrating metabolic medium with nanopatterning and electrostimulation

Affiliations

Comprehensive promotion of iPSC-CM maturation by integrating metabolic medium with nanopatterning and electrostimulation

Wener Li et al. Nat Commun. .

Abstract

The immaturity of human induced pluripotent stem cell-derived cardiomyocytes (iPSC-CMs) is a major limitation for their use in drug screening to identify pro-arrhythmogenic or cardiotoxic molecules. Here, we demonstrate an approach that combines lipid-enriched maturation medium with a high concentration of calcium, nanopatterning of culture surfaces and electrostimulation to generate iPSC-CMs with advanced electrophysiological, structural and metabolic phenotypes. Systematic testing reveals that electrostimulation is the key driver of enhanced mitochondrial development and metabolic maturation and improved electrophysiological properties of iPSC-CMs. Increased calcium concentration strongly promotes electrophysiological maturation, while nanopatterning primarily facilitates sarcomere organisation with minor effect on electrophysiological properties. Transcriptome analysis reveals that activation of HMCES and TFAM targets contributes to mitochondrial development, whereas downregulation of MAPK/PI3K and SRF targets is associated with iPSC-CM polyploidy. These findings provide mechanistic insights into iPSC-CM maturation, paving the way for pharmacological responses that more closely resemble those of adult CMs.


Conflict of interest statement

Competing interests: The authors declare no competing interests.

Figures
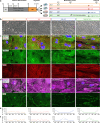
Fig. 1
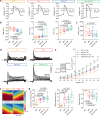
Fig. 1. Study design and structural characterisation of iPSC-CMs.
a Schematic overview of the study design. Differentiated iPSC-CMs were digested on day 15-16 (d15-16) and randomly divided into 4 experimental groups to investigate the effects of maturation medium (MM), nanopatterning (NP) and electrostimulation (ES). Extensive characterisation of the cells was performed on day 42 (d42). For some experiments, including calcium imaging, seahorse assays and multi-electrode array measurements, iPSC-CMs were replated into the corresponding assay plates on d42 and allowed to recover for another 7 days. Created in BioRender. Li, W. (2025) https://BioRender.com/p85e700. b Representative morphology of iPSC-CMs under different conditions at d42. Scale bar, 200 µm for all four groups. c Representative immunostaining for α-actinin, cardiac ryanodine receptor (RYR2) and Hoechst33342. d Representative immunostaining for connexin 43 (Cx43), phalloidin and Hoechst33342. Data (b-d) are based on 3 independent experiments using 3 different iPSC lines. e, f Quantification of sarcomere alignment based on z-disk orientation (e) and nuclei elongation (f). The method used to analyse the sarcomere alignment is shown in Supplementary Fig. 1a. Data were obtained from 2 independent experiments using 2 iPSC lines (n = 4 images/group/experiment). Data are presented as averages of each experiment. Orange, red, blue and green bars represent the four experimental groups: B27, MM, MM + NP, and MM + NP + ES, respectively. Symbols denote iPSC lines: circles for isWT7, and squares for iWTD2. Source data are provided as a Source Data file.
Fig. 2
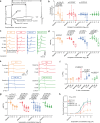
Fig. 2. Assessment of action potential and field potential parameters in iPSC-CMs.
a Spontaneous action potential (AP) traces from the four groups. A notch event (red arrow) is only present in the MM + NP + ES group. b Quantification of spontaneous AP metrics: resting membrane potential (RMP), maximum upstroke velocity (Vmax), and AP amplitude (APA). n = 21, 25, 21 and 14 (Vmax) or 17 (RMP and APA) cells from 4 independent differentiations for the four groups, respectively. c APD90 quantification in APs paced at 0.5 Hz (n = 13, 24, 22 and 20 cells from 4 independent differentiations for the four groups, respectively). d Representative Ito traces recorded in iPSC-CMs from the four groups. e Statistical analysis of Ito in single cells derived from 7 (B27), 9 (MM), and 6 (MM + NP, MM + NP + ES) independent differentiations of 3 iPSC lines. The stimulation protocol is shown as an inset. The holding potential was set at −90 mV. To inactivate INa, a 20-ms pre-pulse to −35 mV was applied. Ito was recorded by increasing the test potential from −40 mV to +60 mV in 10 mV increments, with each pulse lasting 600 ms. f Representative heatmaps of field potential (FP) propagation. The colour scale indicates the time at which the sodium peak of the FP signal propagates from the start time (0 ms) to end points (10 ms). Scale bar indicates the distance of the sodium peak propagation. g Quantification of FP parameters: conduction velocity, spike amplitude and spike slope. n = 24 cultures/group from 4 independent differentiations of 2 iPSC lines. A schematic diagram of FP traces is included in Fig. 6a, showing how the data for spike amplitude and slope were analysed. Symbols in (b, c, g) denote iPSC lines: circles for isWT7, and squares for iWTD2. Source data are provided as a Source Data file. Statistical analysis was performed using Kruskal-Wallis test with Dunn’s multiple comparison test (b, c, g) and two-way ANOVA with Sidak’s multiple comparison test (e): *p < 0.05, **p < 0.01, ***p < 0.001, ****p < 0.0001 compared to the B27 group. Exact p values are provided in the Source Data file. Data are presented in box plots indicating median (middle line), 25th, 75th percentile (box) and min and max data points (whiskers) in (b, c, g) and in line plots as mean ± SEM (e).
Fig. 3
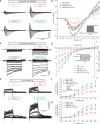
Fig. 3. INa, IK1 and IKr recordings in iPSC-CMs.
a Representative INa traces recorded under 25 mM extracellular Na+ concentration. b Statistical analysis of INa in single cells derived from 9 (B27) and 5 (MM, MM + NP, MM + NP + ES) independent differentiations of 3 iPSC lines. The stimulation protocol is shown as an inset. The holding potential was set at −100 mV. INa was recorded by increasing the test potential from −80 mV to +70 mV in 5 mV steps. Each pulse lasted for 20 ms and the sweep interval was 2 s. c Representative traces of 0.5 mM BaCl2-sensitive IK1 for different groups. d Statistical analysis of BaCl2-sensitive IK1 in single cells derived from 6 (B27, MM, MM + NP + ES) and 5 (MM + NP) independent differentiations of three iPSC lines. The stimulation protocol is shown as an inset. The holding potential was set at −40 mV. IK1 was recorded by increasing the test potential from −130 mV to +10 mV in 10 mV steps, with each pulse lasting for 2 s. The sweep interval was 10 s. The protocol was then repeated in the presence of 0.5 mM BaCl2 and the Ba2+-sensitive current was calculated as IK1. e Shown are traces of 1 µM E−4031-sensitive IKr in the four groups. f, g Averaged E−4031-sensitive IKr step currents (f) and tail currents (g) in single cells derived from 4 independent differentiations of 2 iPSC lines. The IKr pulse stimulation is shown as an inset. The holding potential was set at −50 mV. IKr step currents were recorded by decreasing the test potential from +40 mV to −40 mV in 10 mV steps with each pulse lasting for 2.5 s. The tail currents were recorded in the following 4-s phase at −40 mV. The sweep interval was 10 s. With respect to INa, IK1, and IKr, we did not observe significant differences among three iPSC lines used (Supplementary Fig. 7). Source data are provided as a Source Data file. Two-way ANOVA with Sidak’s multiple comparison test was used for statistical analysis: *p < 0.05, **p < 0.01, ***p < 0.001, ****p < 0.0001 compared to the B27 group. Exact p values are provided in the Source Data file. Data are presented as mean ± SEM.
Fig. 4
Fig. 4. Assessment of calcium handling in iPSC-CMs and effects of calcium concentrations used in media.
a Representative ICa-L recordings in iPSC-CMs cultured under the four conditions. b Statistical analysis of ICa-L in single cells derived from 6 independent differentiations of 3 iPSC lines. c Representative Ca2+ transient traces recorded at 0.5 Hz followed by application of 10 mM caffeine to induce the release of total SR calcium. d Statistical analysis of calcium transient parameters: diastolic Ca2+ level, systolic Ca2+ level, transient amplitude and decay time constant tau measured in iPSC-CMs paced at 0.5 Hz. n = 15, 18, 17, and 20 cells for B27, MM, MM + NP, and MM + NP + ES groups, respectively, from 2 iPSC lines. e SR calcium release induced by 10 mM caffeine. n = 16, 14, 12, and 18 cells for B27, MM, MM + NP, and MM + NP + ES groups, respectively, from 2 iPSC lines. fh Experimental scheme (f), and effects of calcium concentrations on Ca2+ transient amplitude and tau (g, n = 38 cells/group from 2 iPSC lines), and SR Ca2+ release induced by 10 mM caffeine (h, n = 18 and 15 cells for the (RPMI + )B27 and DMEM + B27 groups from 2 iPSC lines, respectively). f is created in BioRender. Li, W. (2025) https://BioRender.com/t88d878. i Effects of calcium concentrations on INa in single cells derived from 9 ((RPMI + )B27) and 6 (DMEM + B27) independent differentiations of 3 iPSC lines. j Effects of calcium concentrations on ICa-L in single cells derived from 6 ((RPMI + )B27) and 4 (DMEM + B27) independent differentiations of 3 iPSC lines. Symbols in (d, e, g, h) denote iPSC lines: circles for isWT7, squares for iWTD2 and triangles for iBM76. Source data are provided as a Source Data file. Statistical analysis was performed using Kruskal-Wallis test with Dunn’s multiple comparison test (d, e) or two-sided Kolmogorov-Smirnov test (g, h). Two-way ANOVA with Sidak’s multiple comparison test was used in (b, i, j) *p < 0.05, **p < 0.01, ***p < 0.001, ****p < 0.0001 compared to the B27 group. Exact p values are provided in the Source Data file. Data are presented as mean ± SEM (b, i, j) and in box plots indicating median (middle line), 25th, 75th percentile (box) and min and max data points (whiskers) in (d, e, g, h).
Fig. 5
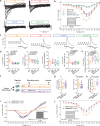
Fig. 5. Analysis of contractility and structural development.
a Analysis of beating rate. CMs of the MM + NP + ES group contracted with a beating rate of 120 BPM (beats per minute) during the presence of ES but regained spontaneous beating after ES was discontinued. n = 15 cultures/group of 5 independent differentiations of 3 iPSC lines. b Statistical analysis of beating properties: contraction time, relaxation time and beating duration of iPSC-CMs under 0.5 Hz field stimulation. n = 15 cultures/group of 5 independent differentiations of 3 iPSC lines. A schematic diagram of two beat traces showing how the parameters were analysed is shown in Supplementary Fig. 2a. c Heatmap of the ability of iPSC-CMs to adapt to increasing pacing frequencies from n = 15 cultures/group of 5 independent differentiations of 3 iPSC lines. The colour scale represents the number of cultures. Representative beating traces are shown in Supplementary Fig. 2b,c. d Expression of denoted marker genes for structural maturation. n = 7 (TNNI1, TNNI3, MYL2, MYL7) and 9 (MYH6, MYH7) independent differentiations of 3 iPSC lines. HPRT is used as a housekeeping gene. e Quantification of cell volume (FSC-A) and granularity (SSC-A) in the cTNT-positive CM populations using flow cytometry analysis. n = 18 independent differentiations/group of 3 iPSC lines. f, g Proportion of cTNT-positive cells (f) and quantification of mean fluorescence intensity of cTNT (g). n = 17 (f) and 11 (g) independent differentiations/group of 3 iPSC lines. Log transformation was performed for statistical analysis (g). The gating strategy used to analyse the flow cytometry data is shown in Supplementary Fig. 3. Symbols denote iPSC lines: circles for isWT7, squares for iWTD2, and triangles for iBM76. Source data are provided as a Source Data file. Statistical analysis was performed using Kruskal-Wallis test with Dunn’s multiple comparison test (b, d) and linear mixed model (two-sided) with Tukey’s correction for multiple comparisons between the 4 groups (ef). Data are presented in box plots indicating median (middle line), 25th, 75th percentile (box) and min and max data points (whiskers).
Fig. 6
Fig. 6. Maturation status of iPSC-CMs affects their drug response.
a Schematic diagram of FP traces showing how the data was analysed. b Quantitative analysis of the effect of verapamil on spike amplitude. n = 17 (B27, MM) and 18 (MM + NP, MM + NP + ES) cultures derived from 3 independent experiments using 2 iPSC lines. Experimental design is shown in Supplementary Fig. 4. c Representative averaged field potential (FP) traces of verapamil-treated iPSC-CMs showing the FPDc (FP duration corrected by Fridericia’s formula) shortening. d Quantitative analysis of the effect of verapamil on FPDc shortening (ΔΔFPDc). n = 17 (B27, MM) and 18 (MM + NP, MM + NP + ES) cultures derived from 3 independent experiments using 2 iPSC lines. e Representative traces illustrating the FPDc prolongation induced by increasing concentrations of E-4031. f Quantitative analysis of the effect of E-4031 on FPDc. n = 10 (B27), 12 (MM), and 11 (MM + NP, MM + NP + ES) cultures from 2 independent experiments. g, h Quantitative analysis of concentration-dependent effect of isoprenaline on FPDc (g) and beating rate (h). n = 18 (B27), 23 (MM, MM + NP), and 24 (MM + NP + ES) cultures derived from 3 (B27) or 4 (MM, MM + NP, MM + NP + ES) independent experiments of 2 iPSC lines. Data are normalised to the respective baseline of each group (b, d, f, g, h). Symbols in (b, d, f, g) denote iPSC lines: circles for isWT7, and squares for iWTD2. Source data are provided as a Source Data file. Statistical analysis using two-way ANOVA with Dunnett’s post-test. Data are presented as mean ± 95% CI (h) and in box plots indicating median (middle line), 25th, 75th percentile (box) and min and max data points (whiskers) in (b, d, f, g).
Fig. 7
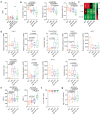
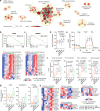
Fig. 7. RNA sequencing of iPSC-CMs cultivated under MM, MM + NP and MM + NP + ES conditions.
ad Volcano plots (ac) and Venn analyses (d) of significantly differentially expressed genes (DEGs, p < 0.01) between iPSC-CMs from MM, MM + NP and MM + NP + ES groups. e Enrichment map illustrating clustered pathways identified in gene set enrichment analysis (GSEA) based on canonical pathway database. The colour scale represents normalised enrichment score (NES). Pathways were filtered based on max. size of 500 genes, NES ≤ −1.9, false discovery rate (FDR) q-value ≤ 0.2 and cluster size of ≥ 2 pathways. f Enrichment plot of SRF_Q4 gene sets obtained with GSEA. g Heatmaps of the expression of SRF target genes significantly downregulated in MM + NP + ES. The colour scale represents z-score. h Western blot of total SRF. n = 4 independent experiments using 2 iPSC lines. Source data are provided as a Source Data file. Statistical analysis was performed using the Wald test of DESeq2 (two-sided) in (ac, g). Exact p values in g are provided in the Source Data file.
Fig. 8
Fig. 8. Cell cycle regulation of iPSC-CMs cultivated under MM, MM + NP and MM + NP + ES conditions.
a Scheme illustrating the expression of cyclin-CDK complexes and respective inhibitors during cell cycle. b Heatmaps of cyclin-CDK complexes, CDK inhibitors, and cytokinesis related genes including those significantly differentially expressed genes among the three groups. The colour scale represents z-score. ce Flow cytometry plots showing cellular DNA content (c), DNA synthesis activity (d), and Ki67 activity (e). f Quantification of diploid and polyploid iPSC-CMs (cTNT-positive populations). Data from 17 independent experiments of 3 iPSC lines. g Proportion of EdU-incorporated iPSC-CMs. Data from 4 independent experiments of 2 iPSC lines. h, i Quantification of diploid and polyploid CMs in Ki67-positive (h) and negative (i) populations. Data from 7 independent experiments of 3 iPSC lines. Symbols in (fi) denote iPSC lines: circles for isWT7, squares for iWTD2, and triangles for iBM76. Source data are provided as a Source Data file. Statistical analysis was performed using the Wald test of DESeq2 (two-sided) in (b) or using linear mixed model (two-sided) with Tukey’s correction for multiple comparisons between the 4 groups (fi). Exact p values in (b) are provided in the Source Data file. Data are presented in box plots indicating median (middle line), 25th, 75th percentile (box) and min and max data points (whiskers) in (fi).
Fig. 9
Fig. 9. Upregulation of TFAM and HMCES target genes contributes to mitochondrial development induced by ES.
a Enrichment maps illustrating clustered pathways identified in gene set enrichment analysis (GSEA) based on canonical pathway database. The colour scale represents normalised enrichment score (NES). Pathways were filtered based on max. size of 500 genes, NES ≥ 1.5, false discovery rate (FDR) q-value ≤ 0.2 and cluster size of ≥ 2 pathways. b, c Enrichment plots and most regulated genes in TFAM and HMCES clusters. The colour scale represents z-score. d Quantification of Tom20 intensity detected in cTNT-positive CM populations. n = 10 independent experiments with 3 different iPSC lines. Log transformation was performed for statistical analysis. e, f Seahorse mean traces (e) and determined parameters (f) were performed with sequential addition of oligomycin (ATP synthase inhibitor), carbonyl cyanide-p-(trifluoromethoxy) phenylhydrazone (FCCP; mitochondrial uncoupler) and rotenone/antimycin A (complex 1 and 2 inhibitor). n = 4 (B27, MM + NP + ES) and 5 (MM, MM + NP) independent experiments using 2 iPSC lines. Orange, red, blue and green lines represent the four experimental groups: B27, MM, MM + NP, and MM + NP + ES, respectively. g Relative expression of OPA1, PPARGC1α and PPARα determined using real-time PCR. HPRT is used as control. Data from 7 (PPARα, PPARGC1α) or 8 (OPA1) independent experiments of 3 iPSC lines. Symbols in (d, f, g) denote iPSC lines: circles for isWT7, squares for iWTD2, and triangles for iBM76. h Heatmaps of selected genes encoding ion channels including those significantly differentially expressed genes among the three groups. The colour scale represents z-score. Source data are provided as a Source Data file. Statistical analysis was performed using linear mixed model (two-sided) with Tukey’s correction for multiple pairwise comparisons between the 4 groups (d, f), Kruskal-Wallis test with Dunn’s multiple comparison test (g), or the Wald test of DESeq2 (two-sided) in (b, c, h). Exact p values in (b, c, h) are provided in the Source Data file. Data are presented as mean ± SEM (e) and in box plots indicating median (middle line), 25th, 75th percentile (box) and min and max data points (whiskers) in (df, g).
Fig. 10
Fig. 10. Effect of ES on iPSC-CM maturation.
a Representative morphology of iPSC-CMs under MM and MM + ES conditions. bd Quantification of cTNT intensity (b), cell volume (FSC-A) and granularity (SSC-A) in the cTNT-positive CMs (c), and Tom20 intensity (d). n = 8 independent experiments with 3 different iPSC lines. Log transformation (b, d) was performed for statistical analysis. e A notch event (red arrow) in an iPSC-CM of the MM + ES group. f Quantification of action potential (AP) metrics: resting membrane potential (RMP), maximum upstroke velocity (Vmax), AP amplitude (APA), and AP duration at 90% repolarization (APD90). For RMP, Vmax and APA: n = 15 (MM) and 22 (MM + ES) cells from 3 (MM) and 4 (MM + ES) independent differentiations of 2 iPSC lines. For APD90: n = 15 (MM) and 20 (MM + ES) cells from 3 (MM) and 4 (MM + ES) independent differentiations of 2 iPSC lines. g Statistical analysis of Ito in single cells derived from 5 independent differentiations of 2 iPSC lines. The stimulation protocol is shown as an inset. h Statistical analysis of beating properties: contraction time, relaxation time and beating duration of iPSC-CMs under 0.5 Hz field stimulation (n = 20 cultures/group from 5 independent differentiations of 3 iPSC lines). i Heatmap of the ability of iPSC-CMs to adapt to increasing pacing frequencies (n = 9 cultures/group from 3 independent differentiations of 3 iPSC lines). The colour scale represents the number of cultures. j, k Shown are flow cytometry plots for DNA content (j) and Ki67 activity (k). l-n Quantification of diploid and polyploid cells in total iPSC-CMs (l) and in Ki67-positive (m) and negative (n) populations. n = 8 independent experiments with 3 different iPSC lines. Symbols in (bd, f, h, ln) denote iPSC lines: circles for isWT7, squares for iWTD2, and triangles for iBM76. Source data are provided as a Source Data file. Statistical analysis was performed using linear mixed model and t-test (two-sided) (bd, ln), Two-way ANOVA with Sidak’s multiple comparison test (g), or two-sided Kolmogorov-Smirnov test (f, h). Data are presented as mean ± SEM (g) and in box plots indicating median (middle line), 25th, 75th percentile (box) and min and max data points (whiskers) in (bd, f, h, ln).

References

    1. Kolanowski, T. J., Antos, C. L. & Guan, K. Making human cardiomyocytes up to date: Derivation, maturation state and perspectives. Int. J. Cardiol.241, 379–386 (2017). - PubMed
    1. Streckfuss-Bomeke, K. et al. Severe DCM phenotype of patient harboring RBM20 mutation S635A can be modeled by patient-specific induced pluripotent stem cell-derived cardiomyocytes. J. Mol. Cell. Cardiol.113, 9–21 (2017). - PubMed
    1. Li, W. et al. Disease phenotypes and mechanisms of iPSC-derived cardiomyocytes from Brugada syndrome patients with a loss-of-function SCN5A mutation. Front. Cell Dev. Biol.8, 592893 (2020). - PMC - PubMed
    1. Jung, C. B. et al. Dantrolene rescues arrhythmogenic RYR2 defect in a patient-specific stem cell model of catecholaminergic polymorphic ventricular tachycardia. EMBO Mol. Med.4, 180–191 (2012). - PMC - PubMed
    1. Li, W. et al. Synergistic adverse effects of azithromycin and hydroxychloroquine on human cardiomyocytes at a clinically relevant treatment duration. Pharmaceuticals15, 220 (2022). - PMC - PubMed

MeSH terms

LinkOut - more resources