. 2025 Mar 21;16(1):2814.
doi: 10.1038/s41467-025-58142-5.

ANXA11 biomolecular condensates facilitate protein-lipid phase coupling on lysosomal membranes

Affiliations

ANXA11 biomolecular condensates facilitate protein-lipid phase coupling on lysosomal membranes

Jonathon Nixon-Abell et al. Nat Commun. .

Abstract

Phase transitions of cellular proteins and lipids play a key role in governing the organisation and coordination of intracellular biology. Recent work has raised the intriguing prospect that phase transitions in proteins and lipids can be co-regulated. Here we investigate this possibility in the ribonucleoprotein (RNP) granule-ANXA11-lysosome ensemble, where ANXA11 tethers RNP granules to lysosomal membranes to enable their co-trafficking. We show that changes to the protein phase state within this system, driven by the low complexity ANXA11 N-terminus, induces a coupled phase state change in the lipids of the underlying membrane. We identify the ANXA11 interacting proteins ALG2 and CALC as potent regulators of ANXA11-based phase coupling and demonstrate their influence on the nanomechanical properties of the ANXA11-lysosome ensemble and its capacity to engage RNP granules. The phenomenon of protein-lipid phase coupling we observe within this system serves as a potential regulatory mechanism in RNA trafficking and offers an important template to understand other examples across the cell whereby biomolecular condensates closely juxtapose organellar membranes.


Conflict of interest statement

Competing interests: Tuomas Knowles and Peter St George-Hyslop are co-founders of TransitionBio. Jonathon Nixon-Abell and Seema Qamar are consultants in TransitionBio. TransitionBio has no involvement in the work described in this paper, but has an interest in biomolecular condensates in cancer and infectious disease. The remaining authors declare no competing interests.

Figures

Fig. 1
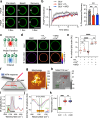
Fig. 1. ANXA11 is a structurally bipartite protein capable of biomolecular condensation and lipid binding.
a A schematic of full length (FL) ANXA11 binding to lysosomal membranes, illustrating the Ca2+-dependent annexin repeat domain (ARD) association with PI(3)P, and the cytosolic-facing low complexity domain (LCD). b Fluorescence micrographs of recombinant AF647-labelled FL (aa 1-502), LCD (aa 1-185) and ARD (aa 186–502) ANXA11 at varying protein concentrations. Scale bar –5 µm. Representative images repeated in three independent experiments (c) Representative fluorescence images of ATTO488 GUVs incubated with 0.5 µM AF555-labelled ANXA11 FL, LCD and ARD in the presence or absence of 500 µM Ca2+. Scale bar –5 µm. d Quantification of the fluorescence intensity of AF555-labelled FL, LCD and ARD recruited to GUVs as shown in (c) at varying Ca2+ concentrations. Mean ± SD. Kruskal-Wallis test with Dunn’s multiple comparison, ***p = 0.0002, ****p < 0.0001, ns - not significant (p > 0.05), n = 3 repeats (110-379 GUVs).
Fig. 2
Fig. 2. ANXA11-GUV binding causes a liquid-to-gel phase transition of lipid membranes.
a Lipid FRAP series of BODIPY-PI(3)P in GUVs in the presence of 100 µM Ca2+ with and without 0.5 µM ANXA11 FL. Scale Bar-5 µm. b PI(3)P fluorescence recovery rates in the presence of 100 µM Ca2+ co-incubated with either 0.5 µM ANXA11 FL or 0.5 µM ARD. The % fluorescence recovery by 5 s is plotted alongside. Mean ± SD. One-way ANOVA with Tukey’s multiple comparison, **p = 0.0014(Ca vs FL) ;0.0036(Ca vs ARD), ns–not significant (p > 0.05), n = 4 GUVs. c Schematic illustrating the change in PK dye fluorescence emission as lipids transition from a disordered (red emission) to ordered (blue emission) state. d Fluorescence images of ATTO647 GUVs labelled with 5 µM PK dye to extract the relative lipid order (φ) of GUVs alone or with 100 µM Ca2+ and either 0.5 µM ANXA11 FL or 0.5 µM ARD. Scale Bar-5 µm. e Quantification of data displayed in (d), including controls. Mean ± SD. One-way ANOVA with Tukey’s multiple comparison, ****p < 0.0001, ns–not significant, n = 3 repeats (30–82 GUVs). f Schematic of AFM-IR setup which acquires nanoscale resolved chemical spectra of protein and lipid components. g AFM-IR morphology maps of GUV fragments bound to ANXA11. Green crosses = ‘lipid only’ signature. Red crosses = ‘protein and lipid’ signatures. Scale bars-2 µm. h Ratio of the infrared maps from protein:lipid (1655/1730 cm−1) spectroscopic signatures. Scale bars–2 µm. i Comparison of the AFM-IR spectra of GUV fragments bound to 0.5 µM ANXA11 FL and 0.5 µM ARD at 100 µM Ca2+. Mean ± SD n = 5 (12–31 GUV fragments) (j) Second derivatives of the spectra in the IR absorption of the C = O stretching region of lipids for GUV fragments alone or bound to either ANXA11 FL or ARD. Mean ± SD, n = 5 (12–31 GUV fragments) (k) Quantification of the wavenumber of GUV fragments alone compared with those bound to ANXA11 FL or ARD. Mean ± SD and 25–75th percentile (box). One-way ANOVA with Tukey’s multiple comparison, ***p = 0.0023, ns–not significant (p > 0.05), n = 5 repeats (12–31 GUV fragments).
Fig. 3
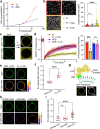
Fig. 3. ANXA11 condensation induces coupled changes in the phase state of lipids in GUV membranes.
a Log(dose) response curves fitted for AF647-labelled ANXA11 FL and ARD binding to GUV membranes at 100 µM Ca2+. Mean ± SD, n = 3. b Fluorescence micrographs of 25 µM recombinant AF647-ANXA11 FL alone or with unlabelled 25 µM LCD or 25 µM Halo. Scale bar–5 µm. Corresponding quantification for condensate area is plotted alongside. Mean ± SD, Kruskal-Wallis with Dunn’s multiple comparison, ****p < 0.0001, ns–not significant (p > 0.05), n = 3 repeats (1171–1439 condensates). c Representative images of ATTO488 GUVs coated in either 0.5 µM ANXA11 FL or 0.5 µM ARD at 100 µM Ca2+ (left). On the right, the same GUVs coincubated with 25 µM AF647-labelled LCD. Scale bar–5 µm. d FRAP recovery curves of 0.5 µM AF647-labelled ANXA11 FL or ARD on the surface of GUVs at 100 µM Ca2+, with and without 25 µM LCD. The corresponding quantification of the % fluorescence recovery after 15 s is plotted alongside. Mean ± SD. One-way ANOVA with Tukey’s multiple comparison, ***p = 0.001, ns–not significant (p > 0.05), n = 4 GUVs. e Fluorescence images of ATTO647 GUVs labelled with 5 µM PK dye to extract the relative order (φ) of membrane lipids. GUVs were incubated with 100 µM Ca2+ and either 0.5 µM ANXA11 or ARD in the presence of 25 µM LCD. Scale bar–5 µm. f Quantification of the relative lipid order (φ) of GUVs as shown in (e). Mean ± SD. Unpaired two-tailed with Welch’s correction, ****p < 0.0001, n = 5 repeats (44–126 GUVs). g A schematic illustrating HIS-LCD conjugation to DGS-NTA(Ni) lipids. Below are images showing 25 µM AF647-labelled HIS-LCD or HIS-Halo binding to NTA(Ni) GUVs. h Fluorescence images of ATTO647 GUVs labelled with 5 µM PK dye to extract the relative order (φ) of membrane lipids. NTA(Ni) GUVs were incubated with either 25 µM HIS-LCD or HIS-Halo. Scale bar–5 µm. i Quantification of the relative lipid order of GUVs as shown in (h). Mean ± SD. One-way ANOVA with Dunnett’s multiple comparison, ****p < 0.0001, ns–not significant (p > 0.05), n = 5 repeats (83–114 GUVs).
Fig. 4
Fig. 4. ALG2 and CALC modulate phase coupling within ANXA11-GUV assemblies.
a Fluorescence micrographs of 25 µM recombinant AF647-ANXA11 FL in the presence of unlabelled 0.1 mM ALG2, 1 mM CALC or 1 mM Halo. The concentrations of the modulators were determined from molar ratios matching their relative abundance in cells (1[ANXA11]:4[ALG2]:40[CALC]). Scale bar–20 µm. b Representative fluorescence images of ATTO488 GUVs incubated with 0.5 µM AF647-ANXA11 FL at 100 µM Ca2+ co-incubated with either 2 µM ALG2 or 20 µM CALC. Scale bar–5 µm. c Quantification of the fluorescence intensity of AF647-ANXA11 FL recruited to GUVs as in (b). Mean ± SD. Kruskal-Wallis test with Dunn’s multiple comparison, ***p = 0.0002, ****p < 0.0001, n = 3 repeats (35–55 GUVs). d Quantification of the fluorescence intensity of 25 µM AF647-labelled HIS-LCD recruited to NTA(Ni)-GUVs co-incubated with either 0.1 mM ALG2 or 1 mM CALC. Mean ± SD. Kruskal-Wallis test with Dunn’s multiple comparison, ****p < 0.0001, n = 3 repeats (117–281 GUVs). e A FRAP recovery profile of 0.5 µM AF647-ANXA11 FL on the surface of GUVs in the presence or absence of 2 µM ALG2 or 20 µM CALC at 100 µM Ca2+. The corresponding quantification of the % fluorescence recovery after 15 s is plotted alongside. Mean ± SD. One-way ANOVA with Dunnett’s multiple comparison ***p = 0.0004, **p = 0.0011, n = 3 GUVs (FL;FL + ALG2) 5 GUVs (FL + CALC). f Fluorescence images of ATTO647 GUVs labelled with 5 µM PK dye to extract the relative order (φ) of membrane lipids. GUVs were incubated with 100 µM Ca2+ and 0.5 µM ANXA11 FL co-incubated with either 2 µM ALG2 or 20 µM CALC. Scale bar–5 µm. g Quantification of the relative lipid order (φ) of GUVs shown in (f). Mean ± SD. One-way ANOVA with Dunnett’s multiple comparison, ***p = 0.0006, ****p < 0.0001, n = 5 repeats (58–134 GUVs). h Quantification of the relative lipid order (φ) of NTA(Ni)-GUVs labelled with 5 µM PK dye. NTA(Ni) GUVs were incubated with 25 µM HIS-LCD and with either 0.1 mM ALG2 or 1 mM CALC. Mean ± SD. One-way ANOVA with Dunnett’s multiple comparison, *p = 0.0318, **p = 0.0045, n = 4 repeats (28–94 GUVs).
Fig. 5
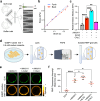
Fig. 5. ALG2 promotes ANXA11 condensation to increase the lipid order of lysosomes in cells.
a U2OS cells under hypotonic conditions (95% ddH2O, 5% DMEM, pH 7.0) expressing a fluorescently labelled lysosome marker (TMEM192-Halo-JF647) and ANXA11 (ANXA11-mEm). The cytosolic pool of ANXA11 was photobleached to reveal ANXA11-membrane associations. The white ROI indicates the displayed zoomed regions. Scale bar - 5 µm. b A representative image of a hypotonic U2OS cell with fluorescently labelled lysosomes (TMEM192-Halo-JF647) incubated in 100 nM PK dye to extract the relative order of lysosomal membrane lipids. The white ROI within the zoomed panels indicates an example analysis segment. Scale bars - 10 µm (left panel) and 1 µm(right panel). c Quantitation of the relative order (φ) of lysosomal membranes as displayed in (b) from U2OS cells alone, or expressing either ANXA11, ANXA11 + ALG2, or ANXA11 + CALC. Mean ± SD. One-way ANOVA with Tukey’s multiple comparison, **p = 0.0021, n = 3 repeats (82–146 lysosomes).
Fig. 6
Fig. 6. ALG2 and CALC alter the nanomechanical properties of ANXA11-GUV assemblies and their ability to tether RNP granules.
a A Schematic of our microfluidic device used to extract the relative elastic modulus of GUVs. The bright-field images on the right illustrate GUV deformation within the device with a channel size: opening = 15 µm, tapered end = 2 µm. b A plot of the GUV deformation (strain) under variable pressure applied across the V-shaped channel (stress). Simple linear regression, R2 (Forth/Back) – 0.991/0.980. ANCOVA-slopes (p = 0.26) and intercepts (p = 0.13) are not significantly different. c Quantification of the relative elastic modulus of GUVs at 100 µM Ca2+ with 0.5 µM ANXA11 FL, coincubated with either 2 µM ALG2 or 20 µM CALC. Mean ± SD. One-way ANOVA with Tukey’s multiple comparison, **p = 0.0023, ****p < 0.0001, n = 3 GUVs. d The experimental pipeline for FAPS-based RNP granule isolation from a stable G3BP1-mEmerald U2OS line. Created in BioRender. Nixon-Abell, J. (2025) https://BioRender.com/j66j626. e Representative fluorescence images of ATTO594 GUVs incubated with 100 µM Ca2+ and 0.5 µM ANXA11 co-incubated with either 2 µM ALG2 or 20 µM CALC. To each condition, purified RNP granules (labelled with mEmerald-G3BP1) were added to a final concentration of 0.2 mg/ml. Scale bar - 5 µm. f Quantification of the fluorescence intensity of RNP granules (mEm-G3BP1) recruited to ANXA11-GUV assemblies as displayed in (e). Mean ± SD. One-way ANOVA with Tukey’s multiple comparison, *p = 0.0111 (A11 vs A11 + ALG2) ;0.0125 (A11 vs A11 + CALC), ****p < 0.0001, n = 7 repeats (21–78 GUV).
Fig. 7
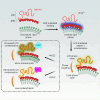
Fig. 7. Protein-lipid phase coupling in the ANXA11-lysosome ensemble.
The ARD of ANXA11 mediates binding to lysosomes in a Ca2+-dependent manner and causes a phase transition in lysosomal membrane lipids into a more ordered state. Condensation of the ANXA11 LCD can then act to tune the magnitude of this lipid phase transition in a coupled manner. ANXA11 interacting partners ALG2 and CALC either increase (ALG2) or decrease (CALC) ANXA11 LCD-based condensation to regulate phase coupled effects on lysosomal membrane lipids.

Update of

References

    1. Heberle, F. A. & Feigenson, G. W. Phase separation in lipid membranes. Cold Spring Harb. Perspect. Biol.3, 1–13 (2011). - PMC - PubMed
    1. Eggeling, C. et al. Direct observation of the nanoscale dynamics of membrane lipids in a living cell. Nature457, 1159–1162 (2009). - PubMed
    1. Shaikh, S. R., Dumaual, A. C., Jenski, L. J. & Stillwell, W. Lipid phase separation in phospholipid bilayers and monolayers modeling the plasma membrane. Biochim. Biophys. Acta - Biomembr.1512, 317–328 (2001). - PubMed
    1. Simons, K. & Ikonen, E. Functional rafts in cell membranes. Nature387, 569–572 (1997). - PubMed
    1. Levental, I., Levental, K. R. & Heberle, F. A. Lipid rafts: controversies resolved, mysteries remain. Trends Cell Biol.30, 341–353 (2020). - PMC - PubMed

Substances

LinkOut - more resources