. 2025 Mar 21;5(1):81.
doi: 10.1038/s43856-025-00789-8.

H105A peptide eye drops promote photoreceptor survival in murine and human models of retinal degeneration

Affiliations

H105A peptide eye drops promote photoreceptor survival in murine and human models of retinal degeneration

Alexandra Bernardo-Colón et al. Commun Med (Lond). .

Abstract

Background: Photoreceptor death leads to inherited blinding retinal diseases, such as retinitis pigmentosa (RP). As disease progression often outpaces therapeutic advances, developing effective treatments is urgent. This study evaluates the efficacy of small peptides derived from pigment epithelium-derived factor (PEDF), which are known to restrict common cell death pathways associated with retinal diseases.

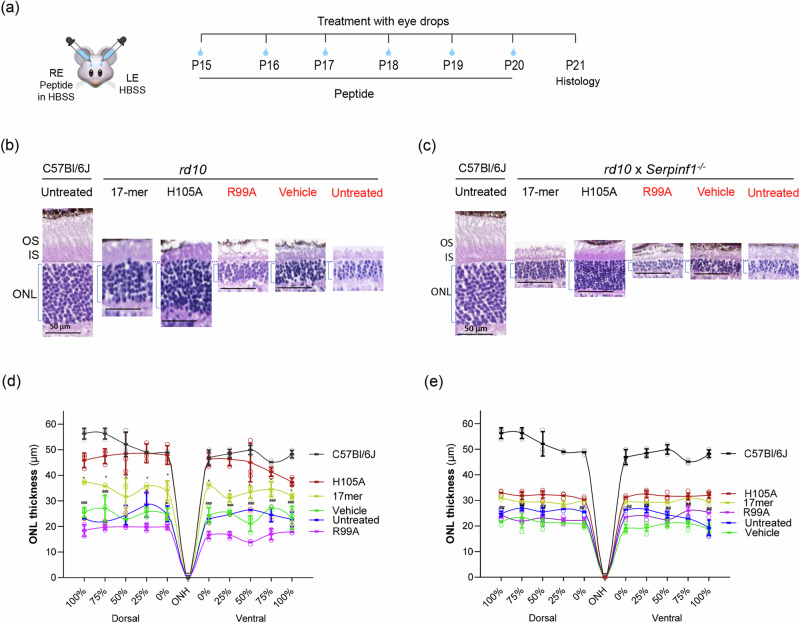
Methods: We tested chemically synthesized peptides (17-mer and H105A) with affinity for the PEDF receptor, PEDF-R, delivered as eye drops to two RP mouse models: rd10 (phosphodiesterase 6b mutation) and RhoP23H/+ (rhodopsin P23H mutation). Additionally, we engineered AAV-H105A vectors for intravitreal delivery in RhoP23H/+ mice. To assess peptide effects in human tissue, we used retinal organoids exposed to cigarette smoke extract, a model of oxidative stress. Photoreceptor survival, morphology and function were evaluated.

Results: Here we show that peptides 17-mer and H105A delivered via eye drops successfully reach the retina, promote photoreceptor survival, and improve retinal function in both RP mouse models. Intravitreal delivery of a AAV-H105A vector delays photoreceptor degeneration in RhoP23H/+ mice up to six months. In human retinal organoids, peptide H105A specifically prevents photoreceptor death induced by oxidative stress, a contributing factor to RP progression.

Conclusions: PEDF peptide-based eye drops offer a promising, minimally invasive therapy to prevent photoreceptor degeneration in retinal disorders, with a favorable safety profile.

Plain language summary

Retinitis pigmentosa (RP) is a rare inherited condition that causes the gradual death of photoreceptors (light-sensing cells) in the eye, leading to vision loss. There is currently no cure. This study tested a potential treatment using small protein fragments (peptides) from PEDF, a protective protein naturally found in the eye. Researchers delivered these peptides through eye drops or gene therapy in mouse models of RP and to human retinal organoids (lab-grown retina tissue). Mice treated early maintained healthy vision cells, while untreated mice experienced rapid cell loss and vision decline. These results suggest that peptide-based eye drops could be a simple, safe, and effective way to slow vision loss in patients with RP.


Conflict of interest statement

Competing interests: US Government and University of Modena and Reggio Emilia, Italy. S. P. Becerra, A. Bernardo-Colón, V. Marigo, A Bighinati. US Application No. 63 430 251 NIH Ref No E-028-2023-0-US-01 and international application PCT/US2023/064947, filed on March 24, 2023. The specific aspect of the manuscript covered in the patent applications is on PIGMENT EPITHELIUM-DERIVED FACTOR PEPTIDES AND USE FOR TREATING RETINAL DEGENERATION.

Figures

Fig. 1
Fig. 1. Penetration and bioavailability of PEDF Peptides 17-mer, H105A, and R99A Delivered via Eye Drops in Mouse Retinas.
a Peptide mapping and sequence. Tertiary structure of human PEDF highlighting the small peptide region with neurotrophic activity (17-mer) in blue (top). Primary structure of human PEDF showing the location of the 17-mer region (middle). Sequences of the 17-mer peptide and its variants, H105A and R99A (bottom). b In vivo detection of peptides. Fundus micrographs showing fluorescence from Alexa Fluor 488-labeled 17-mer, H105A, and R99A peptides in the eyes of C57BL/6J mice at P21 days after eye drop administration of 5 µl of peptide at 1 mg/ml (left). Fundus images were taken at 1, 3-, 6-, 24-, and 48 h post-administration. Quantification of fluorescence intensity over time post-administration (right). The plot shows average intensity from three regions of interest (R.O.I.s) per eye, with five eyes (n = 5) per time point. c Quantification of peptide in retinas. The plot shows the amounts of AlexaFluor-488-labeled peptides (17-mer, H105A, R99A) detected in dissected retinas at each time point. The amount of peptide was quantified from the fluorescence in retinal extracts using standard curves (Supplementary Fig. 1a). Each data point represents the amount of each peptide per eye with three eyes (n = 3) per time point. d Retinal cross-sections showing fluorescence distribution in the photoreceptor layer 1 h after applying eye drops as in Panel B. Representative images for labeled 17-mer, H105A, and R99A peptides are shown, with magnified areas of 17-mer and H105A indicated by dotted rectangles. Magenta arrows point to punctuated areas in the outer segments (OS). IS, inner segments; ONL, outer nuclear layer. e Retinal sections showing PEDF-R distribution (red) and DAPI (blue) in C57BL/6 J mice at P21. Three retinas (n = 3) were used per group, with a representative image shown. A magnified area (yellow dotted rectangle) is provided. f Effects of 17-mer, H105A, and R99A peptides on the PLA2 activity of PEDF-R. Peptides were preincubated with recombinant human PEDF-R[1–288] for 30 min, and PLA2 activity was measured. Each bar represents the average fold-change in activity over control (no peptide) (mean ± SD), from six replicate enzymatic reactions with indicated peptide concentrations and final concentration for PEDF-R of 60 nM.
Fig. 2
Fig. 2. Effect of PEDF peptide eye drops on protection against photoreceptor cell death in rd10 and rd10/Serpinf1-/- mice.
a Illustration of the experimental timeline of peptide application. Eye drops containing 5 µl of 17-mer, H105A, or R99A peptides in HBSS were administered daily to eyes of rd10 and rd10/Serpinf1-/- mice from P15 to P20. Vehicle (HBSS) was applied in contralateral eyes. At P20, PSVue® was applied via eye drops, and fluorescence fundoscopy was conducted at P21 to assess photoreceptor cell death. RE and LE refer to the right and left eyes, respectively. b Fluorescence fundoscopy micrographs. Representative fluorescence fundoscopy images of retinas from mice treated as in Panel a with eyedrops of 1 mg/ml of each peptide. Quantification of fluorescence intensity was performed using ImageJ, with average intensity values corrected for background fluorescence from eyes that had not received PSVue or peptides. Each line represents data from one animal comparing treated and contralateral eyes, with five eyes (n = 5) per condition. Statistical significance was determined by paired t-test (****p ≤ 0.0001, and ns > 0.05). Scale bar = 0.5 mm. c Dose response of peptide eye drops. Representative fluorescence fundoscopy micrographs showing retinas treated with varying concentrations of 17-mer and H105A peptides (0.0 mg/ml to 1.0 mg/ml) in rd10 and rd10/Serpinf1-/- mice. Fluorescence intensity was quantified and analyzed using Sigmoidal interpolation in GraphPad. Each data point represents the average of three images per retina, with a total of five retinas (n = 5) per condition.
Fig. 3
Fig. 3. Eyedrops of 17-mer and H105A peptides decrease the BAX/BCL2 ratio in photoreceptors of rd10 and rd10/Serpinf1-/- mice.
a Illustration of the experimental timeline of peptide application. RE and LE refer to the right and left eyes, respectively. Immunostaining of retinas. Representative fluorescent micrographs of retinas from rd10 (b) and rd10/Serpinf1-/- (c) mice treated with 17-mer or H105A peptides at 1 mg/ml via eye drops, along with vehicle-treated controls. Immunostaining was performed with antibodies against BAX or BCL2 (green), and DAPI (blue). Histograms show quantification of immunofluorescence intensity for BAX and BCL2 markers. Five retinas (n = 5) per group were analyzed, with two sections per retina. Each individual data point represents the average of intensity from two sections per retina, with statistical significance determined by ANOVA Šídák’s multiple comparisons test. ***p ≤ 0.001, ****p ≤ 0.0001, ns p > 0.05. Presented as average of the five retinas ± SD. Scale bar = 40 µm.
Fig. 4
Fig. 4. Effect of eyedrops of 17-mer and H105A peptides on photoreceptor morphology of rd10 and rd10/Serpinf1-/- mice.
a Illustration of the experimental timeline of peptide application. RE and LE refer to the right and left eyes, respectively. Histological Evaluation. Representative microphotographs of retina sections from rd10 (b) and rd10/Serpinf1-/- (c) mice treated with 17-mer, H105A, or R99A peptides at 1 mg/ml, or with vehicle (HBSS), compared to wild type C57BL/6 J mice. Sections were stained with hematoxylin and eosin. Spider Plot illustrate the thickness of the outer nuclear layer (ONL) in rd10 (d) and rd10/Serpinf1-/- (e) mice. Five retinas (n = 5) per group were analyzed and each data point represents the average ± SD per location relative to the optic nerve (ON), analyzed using One-way ANOVA with Šídák’s multiple comparisons test. Statistics for comparisons between H105A and vehicle is indicated by #p ≤ 0.05, ##p ≤ 0.01, and ###p ≤ 0.001, and between H105A and 17-mer by *p ≤ 0.05. Scale bar = 50 µm.
Fig. 5
Fig. 5. Effect of daily eyedrops of PEDF peptides on ERG a-wave and b-wave retinal function.
a Illustration of the experimental timeline of peptide application. RE and LE refer to the right and left eyes, respectively. Representative ERG waveforms for rd10 (b) and rd10/Serpinf1-/- (c) mice at P21 in response to a light flash (1 cd.s/m²). Amplitude (y-axis) is plotted against time in milliseconds (ms, x-axis). Treatments are indicated to the right of each plot and are color coded, with control wild type C57BL/6 J mice without peptide treatment shown in blue. A-wave and b-wave are indicated by arrows. Photoreceptor a-wave amplitudes. Averages of photoreceptor a-wave amplitudes for rd10 (d) and rd10/Serpinf1-/- (e) mice as a function of light intensity (cd/s.m², x-axis). Responses of animals treated with 17-mer are shown in green, H105A in black, and vehicle (HBSS) in red. Wildtype responses are shown in blue. Bipolar cell b-wave amplitudes. Averages of bipolar cell b-wave amplitudes for rd10 (f) and rd10/Serpinf1-/- (g) mice as a function of light intensity (cd/s.m², x-axis), with treatments as indicated in panels. The number of mice evaluated for the data shown in Panels d-g was five (n = 5) for each rd10, rd10/Serpinf1-/- and wild type. Each data point represents the average ± SD of each genotype, analyzed by ANOVA with Dunnett’s multiple comparisons. Statistical significance between H105A and vehicle is indicated by ##p ≤ 0.01, ###p ≤ 0.001, ####p ≤ 0.0001, and between H105A and 17-mer by **p ≤ 0.01, ***p ≤ 0.001, ****p ≤ 0.0001.
Fig. 6
Fig. 6. Effects of eye drops containing H105A peptide in the photoreceptors of RhoP23H/+ mice.
a Scheme of experimental design. Daily peptide eye drops (5 µl of 1 mg/ml peptide) were applied to mice starting at P14 until P19 when immunofluorescence of retinal cross sections was performed. The contralateral control eyes were treated with vehicle HBSS. RE and LE refer to the right and left eyes, respectively. b Immunostaining was performed with antibodies against BAX or BCL2 (green), and DAPI (blue). Histograms show quantification of immunofluorescence intensity for BAX and BCL2 markers. Five retinas per group were analyzed, with two sections per retina. Each individual data point represents the average of five (n = 5) retinas ± SD, with statistical significance determined between H105A and vehicle by paired t-test (****p < 0.0001). Scale bar = 10 µm. c Assessment of ONL and OS at P19, labelled by rhodopsin (red), revealed preservation upon H105 peptide exposure. d Quantification of ONL thickness represented in the spider plot confirms preservation in the ventral retina. Each data point corresponds to the average ± SD, with statistical analysis performed using One-way ANOVA with Šídák’s multiple comparisons for each group presented as average ± SEM. Statistical significance between H105A and untreated is indicated by ∗p ≤ 0.05, and ∗∗p ≤ 0.01. The numbers of retinas per condition were: twenty-four (n = 24) for H105A, fifteen (n = 15) for HBSS, and nine (n = 9) untreated retinas. e Quantification of OS thickness labelled by rhodopsin shows preservation of photoreceptor OS with H105A peptide treatments. n = 9 for each condition. Presented as average ± SD, with statistics performed using One-way ANOVA Šídák’s multiple comparisons test. ∗p ≤ 0.05
Fig. 7
Fig. 7. Effect of AAV-H105A intravitreal injection on the RhoP23H/+ mouse model of RP.
a Scheme for the experimental design illustrating the cDNA construct containing the secretion signal peptide of interferon beta in frame with the H105A coding sequence under the control of the CMV promoter in the AAV vector. One single IVT injection of 0.5 µl of AAV-H105A (1.9 x 1012 GC/ml) or AAV-GFP (4.5 × 1012 GC/ml) (as control) was administered in eyes of RhoP23H/+ mice at P5. Assessments were performed at P19 and P180 by immunofluorescence, and TUNEL of retina sections, and at P180  by ERG in live animals. b Immunostaining of retinal cross-sections of RhoP23H/+ mice at P19 and P180 treated with AAV-vectors as described in Panel a, showing Iba1+ microglia cells (red), rhodopsin (green), with nuclei stained with DAPI (blue). Quantification of Iba1+ microglia cells in the retinal layers is shown on the right-hand side. Five retinas per group were analyzed and data are represented as average ± SD, with statistical analysis performed using One-way ANOVA with Dunnett’s multiple comparisons test for each group.: ∗∗p ≤ 0.01; ∗∗∗∗p ≤ 0.0001. Scale bar: 20 µm. c Immunostaining of retinal cross-sections of mice at P19, treated as described in Panel a, with antibodies to BAX or BCL2 (red), as indicated, and with DAPI (blue). Histograms show quantification of the fluorescence signal. Five retinas per group were analyzed, with two sections per retina. Each data point corresponds to the average ± SD, with statistical analysis performed using Paired t-test for each group.: ∗∗p ≤ 0.01; ∗∗∗∗p ≤ 0.0001. Scale bar: 20 µm. d TUNEL of retinal cross-sections of mice at P19 treated as described in Panel a, showing TUNEL-positive cells (red) with DAPI (blue). Histograms show quantification of the percentage of TUNEL+ photoreceptors. The number of retinas per group analyzed per condition were seven (7) untreated, seven (7) AAV-H105A treated, and six (6) AAV-GFP treated. Each data point corresponds to the average ± SD, with statistical analysis performed using ANOVA with Dunnett’s multiple comparisons test for each group.: ∗p ≤ 0.5, ****p ≤ 0.0001. Scale Bar: 20 µm. e and f ONL thickness in retinas treated as described in Panel a, assessed at P19 (e) and P180 (f), on retinal cross-sections stained with DAPI (blue) and anti-rhodopsin (red). Spider plots for ONL thickness as a function of distance from the optic nerve (ON) are shown. Average ± SEM (panel e) and average ± SD (panel f). For ONL thickness, One-way ANOVA with Šídák’s multiple comparisons for each group was used *p ≤ 0.05. Scale Bar: 20 µm. Visual function assessment by ERG recording at P180 under scotopic (g) and photopic (h) conditions. Sensitivity curves in terms of b-wave amplitude in response to different light stimuli are shown. Each data point corresponds to the average ± SEM, with statistical analysis performed using One-way ANOVA with Dunnett’s multiple comparisons test for each group. For Panel g, n = 21 for AAV-GFP; n = 11 for AAV-H105A; Luminance (log cd*s/m2) 0,09 **p = 0.01393; Luminance (log cd*s/m2) 0.360, **p = 0.00261; Luminance (log cd*s/m2) 1.290, *p = 0.02936; Luminance (log cd*s/m2) 5.120, **p = 0.01037; Luminance (log cd*s/m2) 21.20, **p = 0.00787; Luminance (log cd*s/m2) 83.70, *p = 0.02455. For Panel h, n = 30 for AAV-GFP; n = 17 for AAV-H105A; Luminance (log cd*s/m2) 83.70, *p = 0.0408.
Fig. 8
Fig. 8. Effect of H105A peptide on CSE-induced retinal cell death in human iPSC-derived retinal organoids.
a Diagram of Experimental Design. Human ROs at 180 days of differentiation (D180) were treated with vehicle (DMSO), CSE(500 μg/ml), CSE + R99A(20 nM), CSE + H105A(1 nM), or CSE + H105A(20 nM) for 24 h, and cell death was assessed by PSVue794 or Ethidium homodimer staining of live organoids or by TUNEL staining in fixed RO sections. Diagram created with BioRender.com. b Representative image of retinal organoids. Top panel shows a representative bright field image of ROs at D180. Bottom panel is a close-up of a D180 RO showing neural retina (n.r.), outer nuclear layer (ONL), and inner and outer segment structures of photoreceptors (IS/OS). Scale Bar: 50 μm. c PSVue794 fluorescence intensity (RFU) of PSVue794 in live ROs under the 5 experimental conditions. CSE increases early apoptotic events, evidenced by a statistically significant increase in PSVue794 intensity compared with Vehicle control, and H105A prevents this increase at both tested concentrations. CSE + H105A(1 nM) = 5185.2 ± 275.4 (n = 24) and CSE + H105A(20 nM) = 6342.7 ± 261.3 (n = 24), vs. CSE alone = 10172.6 ± 431.0 (n−19) and CSE + R99A(20 nM) = 8112.5 ± 266.2 (n = 24); Vehicle (n = 19). Mean ± SD; ****p < 0.0001, One-way ANOVA with Tukey’s multiple comparisons test for each group. d Fluorescence intensity (RFU) of Ethidium homodimer in live ROs under each treatment condition. CSE increases cell death, evidenced by a statistically significant increase in fluorescence intensity compared with Vehicle control, and H105A decreases CSE-induced cell death at both tested concentrations. CSE + H105A(1 nM) = 848.9 ± 51.0 (n = 14) and CSE + H105A(20 nM) = 919.2 ± 46.0 (n = 14), vs. CSE alone = 1447.7 ± 175.3 (n = 6) and CSE + R99A(20 nM) = 1283.2 ± 67.6 (n = 14); Vehicle (n = 13). Mean ± SD; ****p < 0.0001, One-way ANOVA Tukey’s multiple comparisons test for each group. e Representative photomicrographs of retinal organoid sections stained with TUNEL to assess apoptosis-induced DNA fragmentation. Dashed lines demarcate ONL. Scale Bar: 50 μm. f Histogram of quantification of TUNEL staining shows a statistically significant increase in cell death in CSE-treated ROs compared to vehicle controls, and a statistically significant decrease in CSE-induced cell death by H105A treatments. Relative TUNEL(+) area: CSE + H105A(1 nM) = 2.77 ± 0.25 (n = 5) and CSE + H105A(20 nM) = 2.35 ± 0.23 (n = 5), vs. CSE alone=7.36 ± 0.25 (n = 5) and CSE + R99A(20 nM) = 5.27 ± 0.50 (n = 5); Vehicle (n = 5). Mean ± SD; ****p < 0.0001, ns = 0.8045 for Veh vs. CSE + H105A(1 nM); ns = 0.9996 for Veh vs. CSE + H105A(20 nM), One-way ANOVA with Tukey’s multiple comparisons test for each group.

Update of

References

    1. Hartong, D. T., Berson, E. L. & Dryja, T. P. Retinitis pigmentosa. Lancet368, 1795–1809 (2006). - PubMed
    1. T. B. O’Neal, E. E. Luther, in StatPearls. (Treasure Island (FL), 2024).
    1. Hanany, M., Rivolta, C. & Sharon, D. Worldwide carrier frequency and genetic prevalence of autosomal recessive inherited retinal diseases. Proc. Natl. Acad. Sci. USA117, 2710–2716 (2020). - PMC - PubMed
    1. Chew, L. A. & Iannaccone, A. Gene-agnostic approaches to treating inherited retinal degenerations. Front. Cell Dev. Biol.11, 1177838 (2023). - PMC - PubMed
    1. Kutluer, M., Huang, L. & Marigo, V. Targeting molecular pathways for the treatment of inherited retinal degeneration. Neural Regen. Res.15, 1784–1791 (2020). - PMC - PubMed

LinkOut - more resources