. 2025 Mar 21;15(1):9779.
doi: 10.1038/s41598-025-93561-w.

Emilia sonchifolia (L.) DC. inhibits the growth of Methicillin-Resistant Staphylococcus epidermidis by modulating its physiology through multiple mechanisms

Affiliations

Emilia sonchifolia (L.) DC. inhibits the growth of Methicillin-Resistant Staphylococcus epidermidis by modulating its physiology through multiple mechanisms

Lili An et al. Sci Rep. .

Abstract

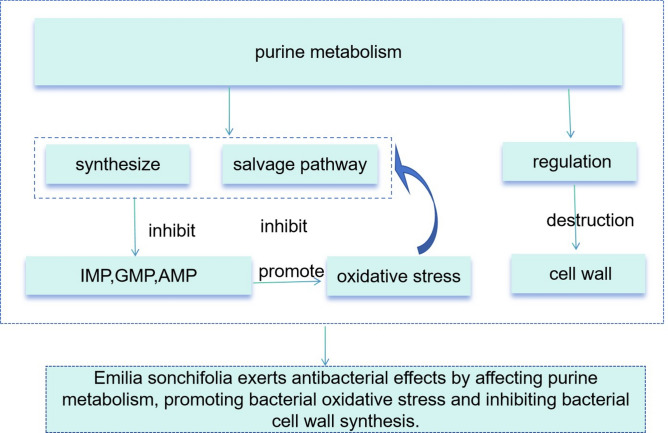
Bloodstream infections (BSIs) are a public health concern, causing substantial morbidity and mortality. Staphylococcus epidermidis (S. epidermidis) is a leading cause BSIs. Antibiotics targeting S. epidermidis have been the mainstay of treatment for BSIs, however their efficacy is diminishing in combating with drug-resistant bacteria. Therefore, alternative treatments for antibiotic-resistant infections are urgently required. Studies have demonstrated that certain traditional Chinese medicine (TCM) exhibit notable antimicrobial activity and can help mitigate bacterial resistance. Among these, The ethanol extract of Emilia sonchifolia (L.) DC (E. sonchifolia) (10 g crude drug/1 g extract ) exhibits a noteworthy anti-methicillin-resistant S. epidermidis (MRSE) effect. This study explores antibacterial activity and underlying mechanisms of E. sonchifolia against MRSE. The antibacterial activity of E. sonchifolia against MRSE was assessed in vitro by measuring the minimum inhibitory concentration (MIC) and minimum bactericidal concentration (MBC). The MRSE-induced mouse BSIs model was used to evaluate the antibacterial activity of E. sonchifolia in vivo. Proteomic and transcriptomic analyses were performed to elucidate the underlying antibacterial mechanisms. The MIC and MBC values of E. sonchifolia against MRSE were 5 mg/mL and 20 mg/mL, respectively. In vivo, E. sonchifolia effectively treated MRSE-induced BSIs. Additionally, proteomic and transcriptomic analyses revealed considerable down-regulation of purine metabolism, that were associated with oxidative stress and cell wall synthesis. The enzyme linked immunosorbent assay(ELISA) results showed decreased levels of inosine monophosphate (IMP), Adenosine monophosphate(AMP) and guanine monophosphate (GMP), indicating inhibited purine metabolism. Scanning electron microscopy (SEM) and transmission electron microscopy (TEM) analysis confirmed bacterial cell wall damage. E. sonchifolia exerts antibacterial effects by inhibiting purine metabolism, promoting bacterial oxidative stress, and impairing cell wall synthesis. These findings provide novel insights into the mechanistic understanding of E. sonchifolia's efficacy against MRSE, offering potential strategies for managing MRSE infections.

Keywords: Emilia sonchifolia; Bloodstream infections; Methicillin-resistant Staphylococcus epidermidis; Purine metabolism.


Conflict of interest statement

Declarations. Competing interests: The authors declare no competing interests.

Figures

Fig. 1
Fig. 1
Investigation of the antibacterial activity of Emilia sonchifolia in vivo. (a) Experimental scheme determining the MRSE-induced BSIs in mice treated with E. sonchifolia. (b) Determination of spleen index in the group A, group B, group C, and group D. (c) Determination of the thymus index in the group A, group B, group C, and group D. (d) Bacterial load in blood 24 h post-infection. The x-axis indicates the mice treated with or without E. sonchifolia. Data are expressed as mean (± SD) of eight replicates (compared with the control, * p < 0.05, ** p < 0.01).
Fig. 2
Fig. 2
Significantly differential proteins of MRSE in 5 mg/mL E. sonchifolia stress using TMT-based quantitative proteomics. (a) The number of DEPs red represent up-regulated proteins, and green represent down-regulated proteins. (b) The horizontal axis is the relative quantitative protein value after Log2 logarithm conversion, and the vertical axis is the difference significance test p-value value after -Log10 logarithm conversion. The red dots indicate up-regulated proteins, and blue dots indicate down-regulated proteins. (c) Hierarchical cluster analysis of differentially expressed proteins between MRSE from control and treated with E. sonchifolia. (d) The number of proteins in different subcellular localization in the proteomics between MRSE from control and treated with E. sonchifolia. (e,f) Go annotation and KEGG pathway of DEPs. (g) Enrichment plot of connectivity between differentially expressed down-regulated proteins on the left and Kyoto Encyclopedia of Genes and Genomes (KEGG) pathway on the right. Each line represents overlap between pairwise comparisons, based on gene set enrichment analysis. (h) KEGG pathway analysis of the up-regulated of KEGG.
Fig. 3
Fig. 3
Remarkably differential proteins of MRSE in 5 mg/mL E. sonchifolia stress using Transcriptomic. (a) Number of DEPs: red represents up-regulated proteins, and green represents down-regulated proteins. (b) Horizontal axis depicts the relative quantitative protein value after Log2 logarithm conversion, and the vertical axis presents the difference significance test p-value value after -Log10 logarithm conversion. The red dots indicate up-regulated proteins, and blue dots indicate down-regulated proteins. (c) Hierarchical cluster analysis of differentially expressed proteins between MRSE from control and those treated with E. sonchifolia. (d,e) GO annotation and KEGG pathway of DEPs. (f) Energy metabolism down-regulates energy metabolism-related pathways in mRNA. (g) KEGG pathway analysis of the down-regulated.
Fig. 3
Fig. 3
Remarkably differential proteins of MRSE in 5 mg/mL E. sonchifolia stress using Transcriptomic. (a) Number of DEPs: red represents up-regulated proteins, and green represents down-regulated proteins. (b) Horizontal axis depicts the relative quantitative protein value after Log2 logarithm conversion, and the vertical axis presents the difference significance test p-value value after -Log10 logarithm conversion. The red dots indicate up-regulated proteins, and blue dots indicate down-regulated proteins. (c) Hierarchical cluster analysis of differentially expressed proteins between MRSE from control and those treated with E. sonchifolia. (d,e) GO annotation and KEGG pathway of DEPs. (f) Energy metabolism down-regulates energy metabolism-related pathways in mRNA. (g) KEGG pathway analysis of the down-regulated.
Fig. 4
Fig. 4
Targeted transcriptomic data based on proteomic pathways were found to be related to pathways with string network of down-regulated proteins.
Fig. 5
Fig. 5
Effect of E. sonchifolia on purine metabolism of MRSE. (a) Effect of E. sonchifolia on GMP concentration in MRSE. (b) Effect of E. sonchifolia on AMP concentration in MRSE. (c) Effect of E. sonchifolia on IMP concentration in MRSE. Data are presented as the mean (± SD) of three replicates (compared with the control, *p < 0.01, **p < 0.01).
Fig. 6
Fig. 6
Effect of Emilia sonchifolia on defense mechanisms of MRSE. (a) Effect of E. sonchifolia on CAT activity in MRSE. (b) Effect of E. sonchifolia on SOD activity in MRSE.
Fig. 7
Fig. 7
Scanning electron microcopy observations of morphology changes in MRSE. (a) MRSE untreated with Emilia sonchifolia. (b) MRSE treated with E. sonchifolia for 4 h. Red arrows indicate regions of the lost cellular integrity.
Fig. 8
Fig. 8
Transmission electron microscopy observations of morphological changes in MRSE. (a) MRSE untreated with E. sonchifolia. (b) MRSE treated with E. sonchifolia for 4 h. Red arrows indicate cell walls. Green arrows indicate cell membranes. Yellow arrows indicate the cytoplasmic contents. Data are presented as mean (± SD) of three replicates (compared with the control, **p < 0.01).
Fig. 9
Fig. 9
Mechanistic hypothesis diagram of the purine metabolism mechanism of E. sonchifolia.

Similar articles

References

    1. Cairns, K. A. et al. Therapeutics for vancomycin-resistant enterococcal bloodstream infections. Clin. Microbiol. Rev.36(2), e0005922 (2023). - PMC - PubMed
    1. Lamy, B., Sundqvist, M. & Idelevich, E. A. Bloodstream infections - Standard and progress in pathogen diagnostics. Clin. Microbiol. Infect.26(2), 142–150 (2020). - PubMed
    1. Fisher, M. et al. Prevention of bloodstream infections in patients undergoing hemodialysis. Clin. J. Am. Soc. Nephrol. CJASN15(1), 132–151 (2020). - PMC - PubMed
    1. Norris, L. B. et al. Systematic review of antimicrobial lock therapy for prevention of central-line-associated bloodstream infections in adult and pediatric cancer patients. Int. J. Antimicrob. Agents50(3), 308–317 (2017). - PubMed
    1. Skovdal, S. M., Jørgensen, N. P. & Meyer, R. L. JMM Profile: Staphylococcus epidermidis. J. Med. Microbiol.10.1099/jmm.0.001597 (2022). - PubMed

MeSH terms

LinkOut - more resources