. 2025 May;17(5):938-966.
doi: 10.1038/s44321-025-00216-4. Epub 2025 Mar 21.

Identification of PTGR2 inhibitors as a new therapeutic strategy for diabetes and obesity

Affiliations

Identification of PTGR2 inhibitors as a new therapeutic strategy for diabetes and obesity

Yi-Cheng Chang et al. EMBO Mol Med. 2025 May.

Erratum in

  • Author Correction: Identification of PTGR2 inhibitors as a new therapeutic strategy for diabetes and obesity.
    Chang YC, Hsieh ML, Lee HL, Hee SW, Chang CF, Yen HY, Chen YA, Chen YR, Chou YW, Li FA, Ke YY, Chen SY, Hung MS, Hung AF, Huang JY, Chiu CH, Lin SY, Shih SF, Hsu CN, Hwang JJ, Yeh TK, Cheng TR, Liao KC, Laio D, Lin SW, Chen TY, Hu CM, Vogel U, Saar D, Kragelund BB, Tsou LK, Tseng YH, Chuang LM. Chang YC, et al. EMBO Mol Med. 2025 May;17(5):1184. doi: 10.1038/s44321-025-00228-0. EMBO Mol Med. 2025. PMID: 40181187 Free PMC article. No abstract available.

Abstract

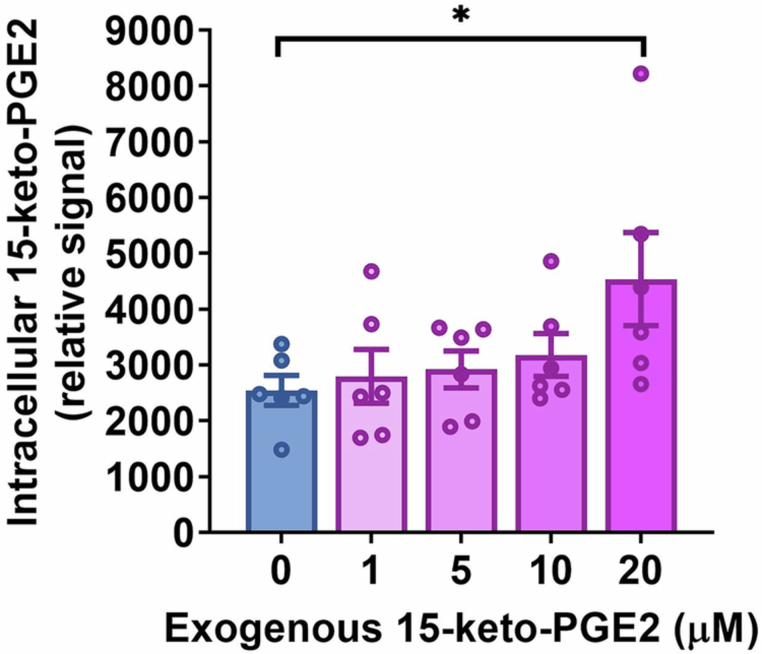
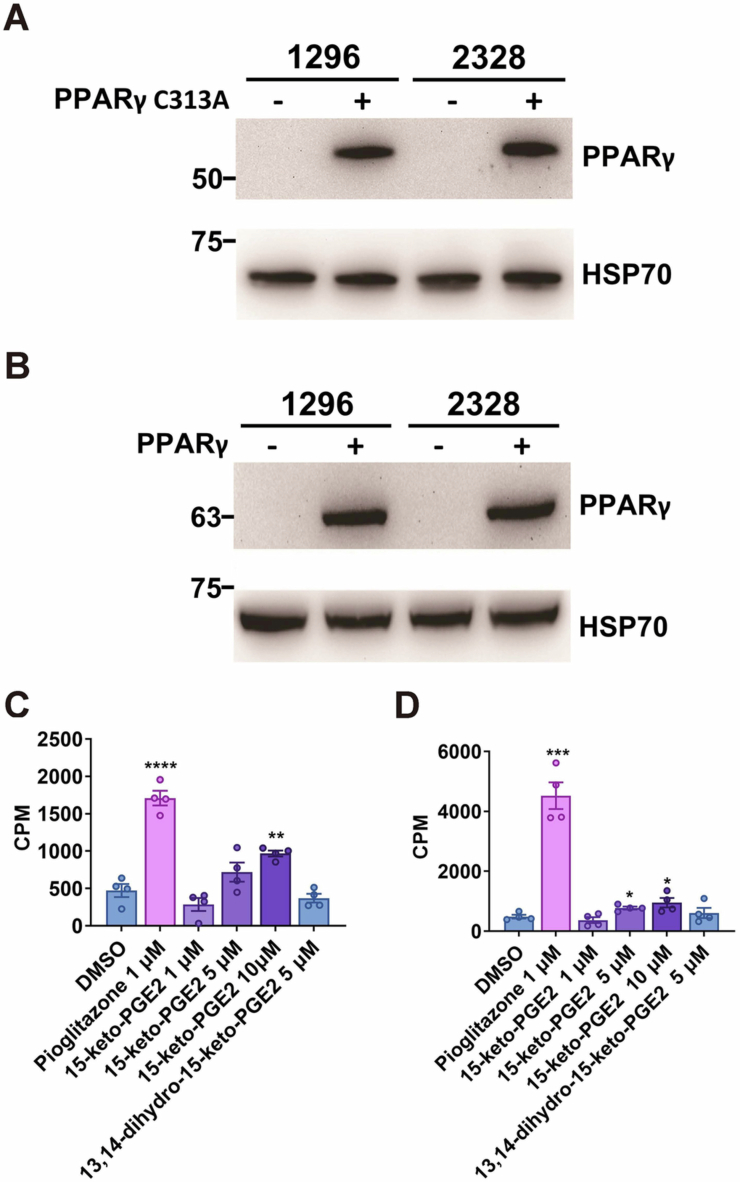
Peroxisome proliferator-activated receptor γ (PPARγ) is a master transcriptional regulator of systemic insulin sensitivity and energy balance. The anti-diabetic drug thiazolidinediones (TZDs) are potent synthetic PPARγ ligands with undesirable side effects, including obesity, fluid retention, and osteoporosis. 15-keto prostaglandin E2 (15-keto-PGE2) is an endogenous PPARγ ligand metabolized by prostaglandin reductase 2 (PTGR2). Here, we confirmed that 15-keto-PGE2 binds to and activates PPARγ via covalent binding. In patients with type 2 diabetes and obese mice, serum 15-keto-PGE2 levels were decreased. Administration of 15-keto-PGE2 improves glucose homeostasis and prevented diet-induced obesity in mice. Either genetic inhibition of PTGR2 or PTGR2 inhibitor BPRPT0245 protected mice from diet-induced obesity, insulin resistance, and hepatic steatosis without causing fluid retention and osteoporosis. In conclusion, inhibition of PTGR2 is a new therapeutic approach to treat diabetes and obesity through increasing endogenous PPARγ ligands while avoiding side effects including increased adiposity, fluid retention, and osteoporosis.

Keywords: 15-keto-PGE2; Diabetes; Obesity; PPARγ; PTGR2.


Conflict of interest statement

Disclosure and competing interests statement. The authors declare no competing interests.

Figures

Figure 1
Figure 1. 15-keto-PGE2 activates murine PPARγ through binding to cysteine 313 residue.
(A) Metabolism of 15-keto-PGE2. (B) Activation of murine PPARγ (mPPARγ) measured by Gal-PPARγ/UAS-LUC reporter assay in HEK293T cells (n = 3 per group, 3 biological replicates with 1 technical replicate each). Cells were transfected with Gal4-PPARγ, UAS-LUC, and TK-Rluc (Renilla luciferase), and treated with pioglitazone (**P = 0.0021, ****P < 0.0001, ***P = 0.0002) or 15-keto-PGE2 (**P = 0.0015, *P = 0.0137, **P = 0.0014). RT-qPCR of (C) Glut4 (****P < 0.0001, **P = 0.0005, ****P < 0.0001) and other mPPARγ-downstream genes including (D) Irs2 (****P < 0.0001, *P = 0.0475, ****P < 0.0001), (E) Sorbs1 (****P < 0.0001, **P = 0.0023), (F) Cd36 (***P = 0.0002, ***P = 0.0006), (G) Acs (****P < 0.0001, **P = 0.0029), (H) Cepba (**P = 0.0016, *P = 0.0274, **P = 0.0025), and (I) Adipoq (**P = 0.0023, ****P < 0.0001, ****P < 0.0001) in differentiated 3T3-L1 adipocytes treated with 15-keto-PGE2 (n = 3 per group, 3 biological replicates with 2 technical replicate each). (J) Effect of 15-keto-PGE2 on insulin-stimulated glucose uptake in differentiated 3T3-L1 adipocytes (****P < 0.0001, ***P = 0.0002, ****P < 0.0001; n = 4 per group, 4 biological replicates with 1 technical replicate each). (K) HEK293T cells transfected by mPPARγ and treated with 15-keto-PGE2. Covalent binding of 15-keto-PGE2 to mPPARγ detected by liquid-chromatography tandem mass spectrometry (LC-MS/MS). (L) Reciprocal co-immunoprecipitation of mPPARγ and cysteine-15-keto-PGE2. Myc-DDK-mPPARγ and Myc-DDK-mPPARγ C313A were expressed in HEK293T cells, and immunoprecipitation (IP) conducted using either anti-DDK (anti-Flag) or anti-15-keto-PGE2-cysteine-BSA antibody, followed by immunoblotting with anti-15-keto-PGE2-cysteine-BSA and anti-DDK antibody. (M) PPRE reporter activity after addition of 15-keto-PGE2 to HEK293T cells transfected with wild-type and C313A mutant mPPARγ (**P = 0.0037, **P = 0.0077, ****P < 0.0001, ****P < 0.0001; n = 3 per group, 3 biological replicates with 1 technical replicate each). (N) Native mass spectrometry spectrum showed the binding of 15-keto-PGE2 to wild-type and mPPARγ mutants (C313A and H351A). The spectrum of unbound free-form proteins was shown in the left panel. The spectrum of bound form after the addition of 15-keto-PGE2 was shown in the right panel (n = 4 per group, 4 independent experiments with 1 technical replicate each) and (O) histogram (****P < 0.0001). (P) 15-keto-PGE2 enhanced insulin-stimulated glucose uptake in PPARγ-null 3T3-L1 clones (#1296; n = 4 per group, 4 biological replicates with 1 technical replicate each) rescued with wild-type mPPARγ (****P < 0.0001, **P = 0.0036) but not in those rescued with mutant mPPARγ (C313A) (****P < 0.0001). (Q) Diagram showing the motifs of mPPARγ and 15-keto-PGE2 binding site. Data information: Data are presented as mean and standard error (S.E.M.). Statistical significance was calculated by one-way analyses of variance (ANOVA) with Tukey’s post hoc test in (BJ, P) and two-sample independent t-test in (M, O). *P < 0.05, **P < 0.01, ***P < 0.001, ****P < 0.0001. ns means no statistical difference. Source data are available online for this figure.
Figure 2
Figure 2. 15-keto-PGE2 prevents diet-induced obesity and improves glucose homeostasis in mice.
(A) Serum 15-keto-PGE2 concentration of non-diabetic human subjects and patients with type 2 diabetic patients (****P < 0.0001; n = 24:24 patients). Correlation of serum 15-keto-PGE2 with (B) homeostasis model assessment of insulin resistance (HOMA-IR) and (C) fasting glucose with serum 15-keto-PGE2 levels in 50 non-diabetic human subjects. (D) Serum 15-keto-PGE2 concentration (****P < 0.0001; n = 5:10 mice) and (E) 15-keto-PGE2 content in inguinal fat (****P < 0.0001; n = 15:7 mice), and (F) perigonadal fat (*P = 0.0124; n = 14:14 mice) of C57BL6/J mice on high-fat high-sucrose diet (HFHSD) or chow. (G) Body weight (*P = 0.0292, *P = 0.0145, *P = 0.0227, *P = 0.0144, **P = 0.0063, **P = 0.0074, **P = 0.0028, **P = 0.0026, **P = 0.0014, ***P = 0.0005; n = 15:15 mice), (H) glucose levels during intraperitoneal glucose tolerance test (ipGTT) (*P = 0.0383, *P = 0.0389, **P = 0.0037, *P = 0.0151, *P = 0.0126, *P = 0.0127; n = 15:15 mice), and (I) insulin tolerance test (ITT) (*P = 0.0448, ****P < 0.0001, ****P < 0.0001, ****P < 0.0001, ****P < 0.0001, *P = 0.0434, ****P < 0.0001; n = 15:15 mice) of HFHSD-fed C57BL6/J mice treated with 15-keto-PGE2 or vehicles. (J) Weights of inguinal fat (*P = 0.0418), perigonadal fat (*P = 0.0253), mesenteric fat (**P = 0.0044), liver, and brown adipose tissue (BAT) of HFHSD-fed C57BL6/J mice treated with 15-keto-PGE2 or vehicles (n = 15:15 mice). (K) Body composition of HFHSD-fed C57BL6/J mice treated with 15-keto-PGE2 or vehicles (*P = 0.0284; n = 15:15 mice) (L) Phospho-Akt levels in perigonadal fat, inguinal fat, muscle, and brown adipose tissue after intraperitoneal insulin injection. (M) H&E stain of perigonadal fat (scale bar=100 μm) and (N) average adipocyte size (**P = 0.0099; n = 15:15 mice). (O) Energy expenditure measured by indirect calorimetry (****P < 0.0001; n = 15:15 mice), (P) food intake (n = 15:15 mice), and (Q) physical activity (n = 15:15 mice) of HFHSD-fed C57BL6/J mice treated with 15-keto-PGE2 or vehicles. (R) Relative Ucp1 expression in inguinal fat (**P = 0.0040), perigonadal fat (*P = 0.0422), and brown adipose tissue (*P = 0.0338) of HFHSD-fed C57BL6/J mice treated with 15-keto-PGE2 or vehicles (n = 13:14 mice with 2 technical replicates each). (S) Body surface temperatures of interscapular area (****P < 0.0001, ***P = 0.0004, **P = 0.0025), inguinal area (***P = 0.0006, *P = 0.0113), and rectal (***P = 0.0001, **P = 0.0019, **P = 0.0050, ****P < 0.0001, *P = 0.0286) temperatures of 15-keto-PGE2-treated mice and vehicle control mice after HFHSD feeding (n = 15:15 mice). (T) Body surface temperatures of interscapular area (*P = 0.0250, *P = 0.0192, *P = 0.0154, *P = 0.0145, *P = 0.0139), inguinal area (*P = 0.0101, **P = 0.0075), and rectal (*P = 0.0233, *P = 0.0376) temperatures of 15-keto-PGE2-treated mice and vehicle control mice during cold test (n = 15:15 mice). Data information: Data are presented as mean and standard error (S.E.M.). Statistical significance was calculated by two-sample independent t-test in (A, DK, NT) and Spearman’s correlation analyses in (B, C). *P < 0.05, **P < 0.01, ***P < 0.001, ****P < 0.0001. Source data are available online for this figure.
Figure 3
Figure 3. Ptgr2 knockout mice were protected from diet-induced obesity, insulin resistance, glucose intolerance, and fatty liver without fluid retention and reduced bone density.
(A) Body weight (*P = 0.0418, **P = 0.0010, ***P = 0.0004, ***P = 0.0003, ***P = 0.0006, ***P = 0.005; n = 20:21 mice), (B) fasting glucose (***P = 0.0004, ****P < 0.0001, ****P < 0.0001, ***P = 0.0001, ****P < 0.0001, ****P < 0.0001; n = 20:21 mice), and (C) glycemic level during intraperitoneal glucose tolerance test (ipGTT) (****P < 0.0001, *P = 0.0331, **P = 0.0081, ***P = 0.0005; n = 20:21 mice) and (D) insulin tolerance test (ITT) (****P < 0.0001, ****P < 0.0001, ****P < 0.0001, ****P < 0.0001, ***P = 0.0004, ****P < 0.0001, ****P < 0.0001; n = 19:20 mice) of Ptgr2 −/− and Ptgr2 +/+ mice on high-fat high-sucrose diet (HFHSD). (E) 18F-FDG PET scan of Ptgr2−/− and Ptgr2+/+ mice after injection of glucose and insulin. (F) 18F-FDG uptake in perigonadal fat (*P = 0.0285), inguinal fat (*P = 0.0373), skeletal muscle, and brown adipose tissue (BAT) after injection of glucose and insulin (n = 14:12 mice). (G) Phospho-Akt levels after intraperitoneal insulin injection in perigonadal fat, inguinal fat, liver, brown adipose tissue, and skeletal muscle. (H) Tissue weights of perigonadal fat (**P = 0.0051), inguinal fat, mesenteric fat, liver (*P = 0.0326), and BAT (*P = 0.0347; n = 11:7 mice). (I) Body composition (****P < 0.0001; n = 14:17 mice), (J) bone mineral density of femur (14:17 mice), (K) micro computed tomography (CT) image of femur of C57BL6/J mice (n = 14:17 mice), and (L) average adipocyte size (*P = 0.0484, n = 14:16 mice with at least 100 cells measured for each mouse). (M) F4/80 immunohistochemical stain of perigonadal fat (scale bar = 50 μm) and (N) percentage of F4/80-positive cells in perigonadal fat (****P < 0.0001; n = 43:56 technical replicates, from 14 and 17 mice with at least 3 images measured for each mouse). (O) H&E stain of liver (scale bar=50 μm) and (P) hepatic triglyceride contents of (**P = 0.0061; n = 6:8 mice) of Ptgr2−/− mice and Ptgr2+/+ on HFHSD. Data information: Data are presented as mean and standard error (S.E.M.). Statistical significance was calculated by two-sample independent t-test in (AD, F, H, I, J, L, N, O, P). *P < 0.05, **P < 0.01, ***P < 0.001, ****P < 0.0001. Source data are available online for this figure.
Figure 4
Figure 4. Ptgr2 knockout mice displayed increased energy expenditure and thermogenesis.
(A) Energy expenditure (the white bar indicates light-up time, the black bar indicates light-off time) (*P = 0.0316, *P = 0.0477, *P = 0.0230, *P = 0.0258, *P = 0.0314, *P = 0.0180, *P = 0.0468, *P = 0.0252, *P = 0.0438, *P = 0.0478, *P = 0.0177, *P = 0.0254, ***P = 0.0004, **P = 0.0042, *P = 0.0361, **P = 0.0024, **P = 0.0035, *P = 0.0303, *P = 0.0292, *P = 0.0405; n = 12:12 mice) (B) Immunoblots showing Ucp1 level in different fat pads. RT-qPCR of genes involved in browning (n = 6:8 mice with 2 technical replicates each) of (C) perigonadal fat (*P = 0.0213, *P = 0.0100, **P = 0.0040, *P = 0.0406), (D) inguinal fat (*P = 0.0213, *P = 0.0213, *P = 0.0213, *P = 0.0100, **P = 0.0023), and (E) brown adipose tissue (BAT) (*P = 0.0293, *P = 0.0200, *P = 0.0293, *P = 0.0200). For the diet-induced thermogenesis test, 24-week-old mice were fasted overnight. Body surface including (F) interscapular area (**P = 0.0034, ***P = 0.0003, ***P = 0.0004, ***P = 0.0004, **P = 0.0029, **P = 0.0056), (G) inguinal area (*P = 0.0448, *P = 0.0334, *P = 0.0216), and (H) core rectal (*P = 0.0375, *P = 0.0481, *P = 0.0158) temperatures at 0, 30, 60, 90, 120, 150, 180, and 240 min after HFHSD refeeding (n = 14:16 mice). Body surface temperatures in (I) interscapular area, (J) inguinal area (*P = 0.0181, *P = 0.0287), and (K) rectal (*P = 0.0411, *P = 0.0466) temperatures during cold tolerance test of Ptgr2−/− mice and Ptgr2+/+ mice on HFHSD (n = 10:10 mice). Data information: Data are presented as mean and standard error (S.E.M.). Statistical significance was calculated by two-sample independent t-test in (A, CK). *P < 0.05, **P < 0.01, ***P < 0.001. Source data are available online for this figure.
Figure 5
Figure 5. PTGR2 inhibitor BPRPT0245 protected mice from diet-induced obesity, insulin resistance, glucose intolerance, and fatty liver without fluid retention and reduced bone density.
(A) Structure of BPRPT0245. (B) Half-maximal inhibitory concentration (IC50) of BPRPT0245. (C) Effect of BPRPT0245 on 15-keto-PGE2-dependent PPARγ transcriptional activity in PTGR2-transfected HEK293T cells (****P < 0.0001, ****P < 0.0001, ****P < 0.0001, ****P < 0.0001, ****P < 0.0001, **P = 0.0014; n = 5 per group, 5 biological replicates with 1 technical replicate each). (D) Intracellular 15-keto-PGE2 content of differentiated 3T3-L1 adipocytes treated with BPRPT0245 (****P < 0.0001, ****P < 0.0001, ****P < 0.0001, **P = 0.0013, **P = 0.0016; n = 3–6 per group, 3–6 biological replicates with 1 technical replicate each) and (E) insulin-stimulated glucose uptake of differentiated 3T3-L1 adipocytes treated with BPRPT0245 (**P = 0.0034, *P = 0.0105; n = 3–4 per group, 3–4 biological replicates with 1 technical replicate each). (F) Molecular docking of 15-keto-PGE2 (green), NADPH (orange brown), and BPRPT0245 (cyan) of PTGR2, Tyr259 (red) of PTGR2. (G) Molecular docking showing that PTGR2 inhibitor BPRPT0245 (cyan) interferes the interaction between 15-keto-PGE2 and NADPH through a strong biding network, Pi-Alkyl (CH) interaction, and Pi-Pi interaction with PTGR2 and NADPH. (H, I) Lineweaver–Burk plots showing the competitive inhibitory action of BPRPT0245 (50 nM) for the interaction between 15-keto-PGE2 and PTGR2 (n = 5, 5 independent experiments with 2 technical replicates) values of Vmax and Km for 15-keto-PGE2 with or without the addition of BPRPT0245 (50 nM) (n = 5, 5 independent experiments with 2 technical replicates). (J) Body weight (*P = 0.0480, *P = 0.0466; n = 15:15 mice), (K) fasting glucose (**P = 0.0054, *P = 0.0141, **P = 0.0070, *P = 0.0414, *P = 0.0251, *P = 0.0427; n = 15:15 mice), (L) glycemic level during intraperitoneal glucose tolerance test (ipGTT) (**P = 0.0014, ****P < 0.0001, ****P < 0.0001, ****P < 0.0001, ****P < 0.0001, ***P = 0.0004, ****P < 0.0001; n = 15:15 mice), (M) insulin tolerance test (ITT) (*P = 0.0163, ***P = 0.0004, *P = 0.0165, *P = 0.0236; n = 15:15 mice), (N) tissue weight of perigonadal fat (**P = 0.0039), inguinal fat (***P = 0.0003), mesenteric fat (**P = 0.0022), liver (**P = 0.0050), brown adipose tissue (BAT) (n = 10:10 mice), (O) body composition (n = 10:10 mice), (P) F4/80 immunohistochemical stain of gonadal fat (scale bar= 100 μm), (Q) percentage of F4/80-positive in perigonadal fat (****P < 0.0001; n = 15:15 mice, with at least 3 images measured for each mouse), (R) adipocyte size (**P = 0.0030; n = 10:10 mice, with at least 100 cells measured for each mouse), (S) representative micro computed tomography (CT) image of femur of C57BL6/J mice, (T) bone mineral density (n = 10:10 mice), (U) representative H&E stain of liver section (scale bar = 100 μm), and (V) hepatic triglycerides content (**P = 0.0014; n = 10:10 mice) of high-fat high-sucrose-fed C67BL6/J mice treated with BPRPR0245 (100 mg/kg/day) and vehicles. Data information: Data are presented as mean and standard error (S.E.M.). Statistical significance was calculated by one-way analyses of variance (ANOVA) with Tukey’s post hoc test in (CE) and two-sample independent t-test in (JM, O, Q, R, T, V). Statistical significance was calculated by two-sample independent t-test in (A, CK). *P < 0.05, **P < 0.01, ***P < 0.001, ****P < 0.0001. Source data are available online for this figure.
Figure EV1
Figure EV1. Relative intracellular 15-keto-PGE2 levels in cultured 3T3-L1 cells treated with exogenous 15-keto-PGE2 of different concentrations (*P = 0.0109; n = 6 per group, 6 biological replicates with 1 technical replicate).
Data information: Data are presented as mean and standard error (S.E.M.). Statistical significance was calculated by one-way analyses of variance (ANOVA) with Tukey’s post hoc test. *P < 0.05.
Figure EV2
Figure EV2. 15-keto-PGE2 enhanced insulin-stimulated glucose uptake in PPARγ2-null adipocytes rescued with wild-type PPARγ2 but not with mutant PPARγ2 (C313A).
Immunoblots showing PPARγ expression in PPARγ-null 3T3-L1 clones #1296 and #2328 using the CRISPR techniques and then overexpress (A) mutant PPARγ2 (C313A) or (B) wild-type PPARγ2. 15-keto-PGE2 enhanced insulin-stimulated glucose uptake in clone #2328 rescue (n = 4 per cell clone, 4 biological replicates with 1 technical replicate) with (C) wild-type (****P < 0.0001, **P = 0.0036) or (D) mutant PPARγ2 (C313A) (***P = 0.0001, *P = 0.0111, *P = 0.0363). Data information: Data are presented as mean and standard error (S.E.M.). Statistical significance was calculated by one-way analyses of variance (ANOVA) with Tukey’s post hoc test and two-sample independent t-test (C, D). *P < 0.05, **P < 0.01, ***P < 0.001, ****P < 0.0001.
Figure EV3
Figure EV3. Relative serum 15-keto-PGE2 concentration and 15-keto-PGE2 content in perigonadal fat were higher in Ptgr2−/− mice compared to Ptgr2+/+ controls.
(A) Relative serum 15-keto-PGE2 level (*P = 0.0352) and (B) relative 15-keto-PGE2 content (**P = 0.0013) in perigonadal fat (n = 8:18 mice) of Ptgr2−/− and Ptgr2+/+ mice on high-fat high-sucrose diet (HFHSD). Data information: Data are presented as mean and standard error (S.E.M.). Statistical significance was calculated by two-sample independent t-test in (A, B). *P < 0.05, **P < 0.01.
Figure EV4
Figure EV4. Relative serum 15-keto-PGE2 concentration and 15-keto-PGE2 content in perigonadal fat were higher in mice treated with BPRPT0245 compared to those receiving the vehicle.
(A) Relative 15-keto-PGE2 contents in perigonadal fat (n = 6:6 mice) and (B) inguinal fat (*P = 0.0117; n = 6:6 mice) after oral gavage of BPRPT0245 (100 mg/kg/day) for 4 days. Samples are harvested 2 h after oral gavage of the latest dose. Data information: Data are presented as mean and standard error (S.E.M.). Statistical significance was calculated by two-sample independent t-test (A, B). *P < 0.05.
Figure EV5
Figure EV5. Comparison between 2D [1H,15N]-TROSY-HSQC NMR (nuclear magnetic resonance) spectra of apo-form and 15-keto-PGE2 bound PPARγ LBD (ligand binding domain).
(A) Comparison between 2D [1H,15N]-TROSY-HSQC NMR spectra of apo-form and 15-keto-PGE2 bound PPARγ LBD (ligand binding domain). Cyanide color indicates missing peak. magenta color indicates chemical shift with Δδ > 0.05. (B) NMR missing peak (cyanide color) and chemical shift (magenta color) mapped onto PPARγ LBD structure.

References

    1. Ahmadian M, Suh JM, Hah N, Liddle C, Atkins AR, Downes M, Evans RM (2013) PPARγ signaling and metabolism: the good, the bad and the future. Nat Med 19(5):557–566 - PMC - PubMed
    1. Ardenkjær-Skinnerup J, Saar D, Petersen PSS, Pedersen M, Svingen T, Kragelund BB, Hadrup N, Ravn-Haren G, Emanuelli B, Brown KA et al (2024) PPARγ antagonists induce aromatase transcription in adipose tissue cultures. Biochem Pharmacol 222:116095 - PubMed
    1. Bruning JB, Chalmers MJ, Prasad S, Busby SA, Kamenecka TM, He Y, Nettles KW, Griffin PR (2007) Partial agonists activate PPARgamma using a helix 12 independent mechanism. Structure 15(10):1258–1271 - PubMed
    1. Brust R, Shang J, Fuhrmann J, Mosure SA, Bass J, Cano A, Heidari Z, Chrisman IM, Nemetchek MD, Blayo AL et al (2018) A structural mechanism for directing corepressor-selective inverse agonism of PPARγ. Nat Commun 9(1):4687 - PMC - PubMed
    1. Capelli D, Cerchia C, Montanari R, Loiodice F, Tortorella P, Laghezza A, Cervoni L, Pochetti G, Lavecchia A (2016) Structural basis for PPAR partial or full activation revealed by a novel ligand binding mode. Sci Rep 6:34792 - PMC - PubMed

LinkOut - more resources