. 2025 Apr;26(4):582-594.
doi: 10.1038/s41590-025-02103-z. Epub 2025 Mar 21.

Enhancing human NK cell antitumor function by knocking out SMAD4 to counteract TGFβ and activin A suppression

Affiliations

Enhancing human NK cell antitumor function by knocking out SMAD4 to counteract TGFβ and activin A suppression

Anna Rea et al. Nat Immunol. 2025 Apr.

Abstract

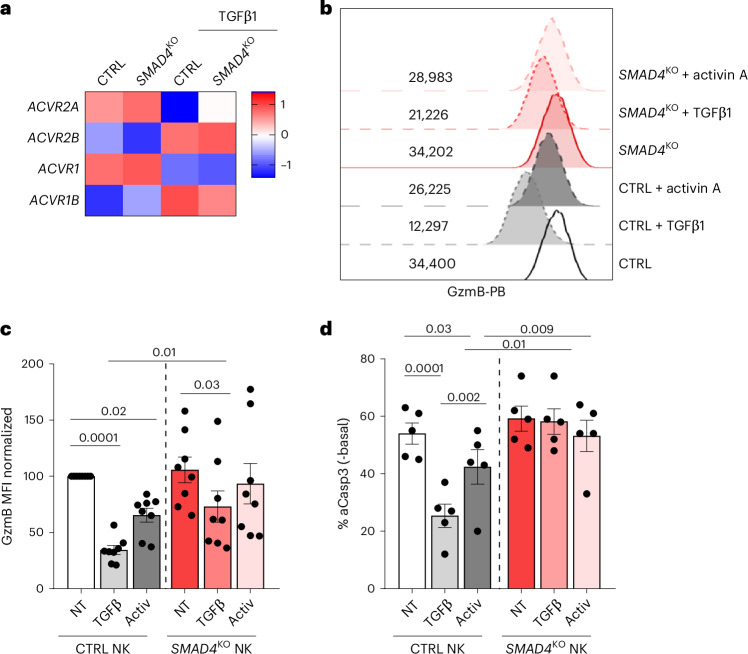
Transforming growth factor beta (TGFβ) and activin A suppress natural killer (NK) cell function and proliferation, limiting the efficacy of adoptive NK cell therapies. Inspired by the partial resistance to TGFβ of NK cells with SMAD4 haploinsufficiency, we used CRISPR-Cas9 for knockout of SMAD4 in human NK cells. Here we show that SMAD4KO NK cells were resistant to TGFβ and activin A inhibition, retaining their cytotoxicity, cytokine secretion and interleukin-2/interleukin-15-driven proliferation. They showed enhanced tumor penetration and tumor growth control, both as monotherapy and in combination with tumor-targeted therapeutic antibodies. Notably, SMAD4KO NK cells outperformed control NK cells treated with a TGFβ inhibitor, underscoring the benefit of maintaining SMAD4-independent TGFβ signaling. SMAD4KO conferred TGFβ resistance across diverse NK cell platforms, including CD19-CAR NK cells, stem cell-derived NK cells and ADAPT-NK cells. These findings position SMAD4 knockout as a versatile and compelling strategy to enhance NK cell antitumor activity, providing a new avenue for improving NK cell-based cancer immunotherapies.


Conflict of interest statement

Competing interests: A. Rea, M.S.-G. and A.M. are inventors of a filed patent (EP23383142, submitted 8 November 2023) pertaining to the results presented in the paper. The other authors declare no competing interests.

Figures

Fig. 1
Fig. 1. Effect of TGFβ and SMAD4 gene dose on NK cell phenotype and function.
a, Dot plots showing the expression of indicated markers in circulating NK cells from a healthy individual (HD) and two individuals with JPS (P_1, P_2). bd, PBMCs were cultured on anti-CD16-coated plates with IL-2 ± TGFβ1 for 6 days. b, NK cell numbers at day 6. Dotted line indicates 100%. c, Representative dot plots of granzyme B (GzmB) expression analyzed by flow cytometry in NK cells from an HD and an individual with JPS cultured in the indicated conditions. Inset numbers indicate mean fluorescence intensity (MFI). d, Mean ± s.e.m. granzyme B and NKG2D fluorescence intensity and proportions of CD103+ NK cells from two individuals with JPS (P, SMAD4+/−) and from a healthy control (HD, SMAD4+/+) at day 6, by multiparametric flow cytometry. MFI data were normalized to those of cells activated in the absence of TGFβ1. e, Mean ± s.e.m. degranulation (CD107a+) and TNF production by NK cells from healthy donors (SMAD4+/+, n = 2) and individuals with JPS (SMAD4+/−, n = 2) treated or not with TGFβ1 upon 4 h coculture with K562 cells by flow cytometry. Basal CD107a and TNF NK cell values in the absence of targets were subtracted. Source data
Fig. 2
Fig. 2. Efficiency of SMAD4KD by CRISPR–Cas9 in in vitro expanded human NK cells.
a, PBMCs from healthy donors were expanded with irradiated 8,866 feeder cells. At day 7, NK cells were isolated and nucleofected with either SMAD4 gRNA or control (CTRL) Cas9–gRNA RNP. After overnight culture, cells were further expanded in the presence of IL-2 ± TGFβ1 for 6 days. b, Mean ± s.e.m. SMAD4 expression by intracellular flow cytometry in control and SMAD4KO NK cells cultured or not with TGFβ1 (n = 6). c,d, TGFβ canonical signaling molecules in control NK and SMAD4KO NK cells by western blot. c, Representative western blots for TGF-BRII, pSMAD2, SMAD4, TIF1γ, SMAD7 and β-actin. d, Quantification of western blot data from three independent engineering experiments with cells from different donors. Bar graphs show the mean ± s.e.m. eh, Cas9-targeted sequence in SMAD4 was amplified by PCR, sequenced by Illumina and analyzed against the reference sequence. Data from engineered NK cells from three individuals in three independent experiments (D1, D2, D3). e, Allelic frequencies of out-of-frame (OUT) and in-frame (IN) indels in the presence/absence of TGFβ1. f, SMAD4 genotype frequencies estimated by the Hardy–Weinberg principle in the presence or absence of TGFβ1. g, Allelic frequencies of the three predominant SMAD4 mutated alleles found in NK cells from all three individuals. Horizontal dashed line in e and g indicates 50%. h, The three most common mutations found in SMAD4 exon 5. Black outlines indicate the number of nucleotides inserted or deleted in the SMAD4 exon 5 and the exact nucleotide site where the mutation is found. Statistical significance by one-way analysis of variance (ANOVA) followed by Tukey’s multiple-comparisons test for b and d. WT, wild type. Source data
Fig. 3
Fig. 3. TGFβ-dependent and -independent effects of SMAD4 in human expanded NK cell transcriptome and phenotype.
af, Average changes in gene expression between control and SMAD4KO NK cells from three different donors. a, Number of DEGs between indicated conditions (P value < 0.01). b, DEGs between control and SMAD4KO NK cells ± TGFβ1. Red dots indicate significant DEGs. ce, Expression of selected genes related to NK cell receptors and signaling adaptors (c), NK cell effector molecules (d) and soluble mediators (e). f, Gene-set enrichment analysis (GSEA) of RNA-seq data from control and SMAD4KO NK cells treated with TGFβ1 against liver and intestine CD56lo NK/type 1 innate lymphoid cells (ILC1; GSE37448). NES, normalized enrichment score. g, Mean ± s.e.m. expression of surface NKG2D (n = 11), CD16 (n = 7), NKp30 (n = 5) and intracellular GzmB (n = 9) and perforin-1 (n = 6) in control and SMAD4KO NK cells ± TGFβ1 by flow cytometry. Dots show data from independent experiments. h, Mean percentage of cells positive for NKp46, KIR, NKG2A, NKG2C, CD57 and KLRG1 in control NK and SMAD4KO NK cells ± TGFβ1 by flow cytometry. Asterisks label significant differences in control NK cells in the absence of TGFβ1 (NT). i, Expression of IL2 and IL15 receptor transcripts in control and SMAD4KO NK cells by bulk RNA-seq. j,k, IL-2-driven proliferation of NKp46-activated, CFSE-labeled control and SMAD4KO NK cells in the presence or absence of TGFβ1 by flow cytometry. j, Data are from one representative experiment. The vertical dashed line indicates the lowest CFSE labeling at day 0, for helping in the visualization of differences between conditions. k, Mean ± s.e.m. percentage of divided cells at day 6. Statistical significance by one-way ANOVA test. l, Control and SMAD4KO NK cells were expanded with K562-CD137L-IL15tmb-IL21tmb feeder cells for 7 days with IL-2 ± TGFβ1. Median, minimum and maximum NK cell expansion fold at day 7 in each culture condition. Statistical significance by two-tailed moderated t-test in a and b, one-way ANOVA followed by Tukey’s multiple-comparisons test in g, and one-way ANOVA followed by uncorrected Fisher’s test in k and l. FC, fold change. Source data
Fig. 4
Fig. 4. In vitro and in vivo SMAD4KO NK cells antitumor function.
a, Mean ± s.e.m. percentage of activated caspase-3-positive HCT116 cells after coculture with control NK and SMAD4KO NK cells treated with IL-2 ± TGFβ1 at the indicated effector:target (E:T) ratios analyzed by flow cytometry. Spontaneous active caspase-3 levels were subtracted. Data are from four independent experiments. b,c, Amount of CCL5 (b) and IFNγ (c) in cell-free culture supernatants of control NK and SMAD4KO NK cells after coculture with the HCT116 cell line by ELISA. Each dot shows data from an independent experiment (n = 4). df, HCT116-GFP+-Luc+ spheroids were cocultured with PKH26-labeled control NK or SMAD4KO NK cells previously exposed or not to TGFβ1. Images were taken at 6 h and 24 h. d, Representative image of one spheroid in each coculture at 24 h. e, Mean ± s.e.m. GFP intensity along time in each coculture. Data are from two independent experiments including five technical replicates each. Only the significance by two-way ANOVA followed by Tukey’s multiple-comparisons test between TGFβ1-treated control and SMAD4KO NK cells at 30 h is indicated. f, Mean ± s.e.m. luciferase activity of remaining HCT116 spheroids after 24 h of coculture with NK cells. Each dot represents the average cytotoxic activity of NK cells in four independent experiments. g,h, Tumor growth kinetics of HCC1954 xenografts in NSG mice treated with: (i) trastuzumab (Tz)/pertuzumab (Pt) (n = 4); (ii) control NK cells (2 × 105, n = 5); (iii) SMAD4KO NK cells (2 × 105, n = 5); (iv) control NK cells (1 × 105) and trastuzumab/pertuzumab (n = 5); or (v) SMAD4KO NK cells (1 × 105) and trastuzumab/pertuzumab (n = 5). g, Treatment schedule. h, Tumor volume fold change in each treatment group. Only differences between control and SMAD4KO NK cells at last measurement are indicated. i, Tumor growth kinetics of HCT116 xenografts in NSG mice treated with either control or SMAD4KO NK cells (2 × 105). Tumor volume fold change in each treatment group (n = 5 in NT group, n = 6 in control and SMAD4KO NK cell groups). Statistical significance by two-way ANOVA followed by Tukey’s multiple-comparisons test at last measurement for a, e, h and i; and one-way ANOVA followed by Tukey’s multiple-comparisons test for b, c, f and g. RLUs, relative light units. Source data
Fig. 5
Fig. 5. The impact of of SMAD4 and TGFβ in the integrin profile, tumor penetrance and transmigration of NK cells.
a, Mean transcript levels of adhesion molecules by RNA-seq analysis. b, Mean ± s.e.m. percentage or intensity of surface expression levels of CD11a (n = 4), CD18 (n = 3), CD49d (n = 5), CD103 (n = 6) and CD29 (n = 5) by flow cytometry in control and SMAD4KO NK cells treated or not with TGFβ1. Each dot indicates the results from an independent experiment with NK cells from different individuals. ce, HCT116 spheroids were cocultured with control NK or SMAD4KO NK cells previously exposed or not to TGFβ1. After 1 h coculture, spheroids and attached NK cells were fixed and processed for light-sheet imaging. HCT116 cells were labeled with an anti-EpCAM-FITC antibody and NK cells with an anti-CD45-Vio R667. c, Image of a representative HCT116 spheroid (green surface) cocultured with SMAD4KO NK cells (red dots). d, Number of NK cells counted in spheroids in the indicated conditions. e, Quantification of the distance between the spheroid surface and each infiltrating NK cell. Each dot represents the measurement of one infiltrating NK cell in one experiment. f, Mean ± s.e.m. fluorescence intensity of surface CXCR3 (n = 9), CCR5 (n = 6) and CXCR4 (n = 4) in control and SMAD4KO NK cells treated or not with TGFβ1 by flow cytometry. Each dot shows data from independent experiments. g, Transcript expression levels of chemokine receptors in control NK and SMAD4KO NK cells exposed or not to TGFβ1, according to RNA-seq data from three independent donors. The dashed lines in a and g separate genes downregulated from those upregulated by TGFβ in control NK cells. h, Mean ± s.e.m. percentage of transmigrating control or SMAD4KO NK cells treated with TGFβ1 to CCL5, CXCL9, SDF-1/CXCL12 or the indicated chemokine combinations. Data are from four independent experiments with NK cells from different donors. In all assays, statistical significance was calculated by one-way ANOVA followed by Fisher’s test. Source data
Fig. 6
Fig. 6. SMAD4KO NK cells display superior cytotoxicity than control NK cells treated with a TGFBR-I inhibitor.
ad, SMAD4KO and control NK cells were expanded in the presence of TGFβ1 for 7 days. Control NK cells were treated with the TGFBR-I inhibitor SB-431542 (SB inhib). a,b, SMAD4, pSMAD2 and β-actin levels in total cell extracts by western blot in SMAD4KO and control NK cells. a, Representative western blots including NK cells from two different donors. b, Quantification of mean ± s.e.m. levels of SMAD4/β-actin and pSMAD2/β-actin ratios in NK cells from three different donors. Statistical significance was calculated by a two-tailed, unpaired Student’s t-test. c, Representative histograms showing the expression of GzmB, NKG2D and CD103 in the indicated NK cells by flow cytometry. d,e, SMAD4KO and control NK cells treated with SB-431542 were cocultured with HCT116-GFP+-Luc+ spheroids. Luciferase counts were analyzed at 24 h of coculture. d, Mean ± s.e.m. luciferase counts from one representative experiment. Dots show data from five technical replicates. e, Mean ± s.e.m. luciferase counts from three independent experiments using NK cells from different individuals. Each dot indicates the mean of five technical replicates for each condition/experiment. Statistical significance was calculated by one-way ANOVA followed by Tukey’s multiple-comparisons test for d and e. Source data
Fig. 7
Fig. 7. The effect of activin A in control and SMAD4KO NK cells.
a, Relative transcript expression of activin receptor genes in the indicated NK cells. Average expression in NK cells from three independent individuals as analyzed by RNA-seq. bd, SMAD4KO and control NK cells were incubated with TGFβ1 or activin A for 7 days. b, Expression of GzmB at day 7 by flow cytometry. c, Mean ± s.e.m. granzyme B levels in SMAD4KO and control NK cells. Data are from experiments with NK cells from eight different individuals. d, SMAD4KO and control NK cells previously incubated with TGFβ1 or activin A (Activ) were cocultured with HCT116 cells for 2 h. Mean ± s.e.m. percentage of active caspase-3+ (aCasp3) HCT116 cells in the indicated conditions. Data are from five independent experiments with NK cells from different individuals. Statistical significance was calculated by one-way ANOVA followed by Fisher’s test. Source data
Fig. 8
Fig. 8. The knockout of SMAD4 improves the resistance to TGFβ of diverse NK cell products in clinical development.
ac, Control and SMAD4KO NK cells transduced with anti-CD19-CAR lentivirus were cultured with IL-2 ± TGFβ1 for 6 days. a, Mean ± s.e.m. percentage of control or SMAD4KO NK cells transduced with the anti-CD19-CAR by flow cytometry. Data are from three independent experiments. b,c, CAR19-transuced control or SMAD4KO NK cells treated with IL-2 ± TGFβ1 were cocultured with Nalm6-GFP+-Luc+ for 3 h at a 4:1 E:T ratio. b, Mean ± s.e.m. luciferase counts at the end of the coculture in the indicated conditions. Dots show data from technical replicates (n = 4) in a representative experiment. c, Mean ± s.e.m. percentage of Nalm6 cell killing in the indicated conditions. Dots show data of independent experiments with CD19-CAR NK cells from different donors (n = 4). df, Control and SMAD4KO GTA002 cells were cultured in IL-2 ± TGFβ1 for 5 days. Data are from four independent experiments. GTA002 cells from different cord-blood units are presented as independent dots. d, SMAD4 MFI in control and SMAD4KO GTA002 cells at day 5. e, Mean ± s.e.m. percentage of NKG2D+ control or SMAD4KO GTA002 cells in the indicated conditions. f, Mean luciferase activity remaining after 24 h coculture of HCT116-GFP+-Luc+ spheroids with control or SMAD4KO GTA002 cells in the indicated conditions. Sph, spheroid. gi, Control or SMAD4KO ADAPT-NK cells were cultured for 5 days with IL-2 ± TGFβ1. Degranulation and IFNγ production were analyzed by coculturing control or SMAD4KO ADAPT-NK cells with K562 cells at a 1:1 E:T ratio for 4 h. Dots represent data from independent experiments using ADAPT-NK cells from different donors. g, SMAD4 MFI in control and SMAD4KO ADAPT-NK cells at day 5. h,i, Mean ± s.e.m. percentage of CD107+ (h) and IFNγ+ (i) control and SMAD4KO ADAPT-NK cells in the indicated conditions. Basal degranulation and IFNγ production in the absence of target were subtracted. Statistical significance was calculated by a two-tailed, paired Student’s t-test in d and g, and by one-way ANOVA followed by Fisher’s test in b, c, e, f, h and i. Source data
Extended Data Fig. 1
Extended Data Fig. 1. Biological pathways modulated in TGF-β-treated NK cells.
Reanalysis of publicly available microarray data of CD16-activated human NK cells in the presence or absence of TGF-β1 (GSE156200). a, b, c) Volcano plot and Heat Maps showing global and selected differential expressed genes (DEG) (|log fold-change|> or <0.5; pval <0.05). d) DEG in TGF-β1-treated versus non-treated activated NK cells were separately introduced in metascape software. Bar graph showing biological pathways down- or up-regulated in TGF-β1-treated NK cells. Source data
Extended Data Fig. 2
Extended Data Fig. 2. SMAD4 expression and NK cell phenotype in PBMC from SMAD4 haploinsufficient patients.
a, b) SMAD4 and β-actin expression in fresh PBMC from two patients with juvenile polyposis syndrome (P#1, P#2) and two healthy donors (HD#1 and HD#2) by western blot. Mutations for each JPS patient are indicated. c-f) PBMC from a healthy donor and the two JPS patients were cultured on anti-CD16-coated plates with of IL-2 ± TGF-β1 for 6 days. c) Gating strategy and dot plots fo Granzyme B (d), NKG2D (e) and CD103 (f) expression as analysed by flow cytometry. Inset numbers indicate MFI for Granzyme B and NKG2D and percentages of CD103 + NK cells.
Extended Data Fig. 3
Extended Data Fig. 3. Cas9 RNP nucleofection efficiency and SMAD4 reduction on primary human expanded NK cells.
a-b) NK cells isolated at at day 7 post expansion were nucleofected with ATTO550-labeled sgRNA control or SMAD4 gRNA complexed to Cas9. Monitorization of nucleofection efficiency after overnight culture by flow cytometry. a) Dot plot showing the percentage of nucleofected cells (ATTO550 + ) in one representative nucleofection. b) Mean ± SEM nucleofection efficiency in 13 independent experiments. c) SMAD4 expression in NK cells after 7 days culture with IL-2 ± TGF-β as analysed by flow cytometry. Inset numbers indicate Mean fluorescence intensity. Histograms corresponding to the control staining with the secondary antibody (abII) for every condition are shown. Data from one representative experiment. Source data
Extended Data Fig. 4
Extended Data Fig. 4. Analysis of off-target gene editing.
a) Alignment of SMAD4 crRNA with putative off-target events. PAM is indicated in lower case. b) Bar graphs showing the percentage of sequenced reads with identical alignment to SMAD4 or to the potential off-target genes DCTN5, CREBBP and NUFIP2 as analysed in SMAD4KO NK cells. Each dot represents data from SMAD4KO NK cells from different individuals (n = 3). Source data
Extended Data Fig. 5
Extended Data Fig. 5. Biological pathways down-regulated in SMAD4KO NK cells.
Biological pathways down-regulated in SMAD4KO as compared to control-engineered expanded NK cells according to Metascape unsupervised analysis.
Extended Data Fig. 6
Extended Data Fig. 6. Extended phenotype of control and SMAD4KO NK cells treated or ot with TGF-β.
Expression of NK cell receptors and effector molecules in control and SMAD4KO NK treated with Il-2 ± TGF-β1 were analyzed by flow cytometry. a) Histograms showing the expression of surface NKG2D, CD16, NKp30 and intracellular granzyme B (GzmB) and perforin-1 in NK cells from a representative donor. b) Density plots showing the surface expression of CD16, NKG2A, KIR, NKG2C and CD57 in control- and SMAD4KO NK cells of a representative donor. Expansion fold (c) and phenotype (d) of control and SMAD4KO NK cells in two consecutive restimulations with K562-CD137L-1L15tmb-IL21tmb feeder cells. Source data
Extended Data Fig. 7
Extended Data Fig. 7. Function of control and SMAD4KO NK cells treated or not with TGF-β.
a) Mean ± SEM TNF in culture supernatants of control- and SMAD4KO NK cells after 2 h coculture with HCT116 cells as analysed by ELISA. Statistical significance calculated by one-way ANOVA followed by Fisher’s test. b) HCT116-Luc + -GFP+ spheroids were cocultured with control- or SMAD4KO NK cells previously treated with IL-2 ± TGF-β. Mean ± SEM Luciferase activity of remaining HCT116 cells after 24 h coculture. Data from 3 independent experiments using NK cells from different donors. Each dot represents data from the 5 technical replicates included in each condition. Statistical significance calculated by one-way ANOVA followed by Turkey’s multiple comparisons test. c) HCC1954 xenografts in NSG mice were treated with either: i) trastuzumab (Tz)/pertuzumab (Pt)(n = 4); ii) control NK cells (2 × 10⁵,n = 5); iii) SMAD4KO NK cells (2 × 10⁵,n = 5); iv) control NK cells (1 × 10⁵) and trastuzumab/pertuzumab (n = 5) or v) SMAD4KO NK cells (1 × 10⁵) and trastuzumab/pertuzumab (n = 5). Tumor volume in each treatment group. Statistical significance between control and SMAD4KO NK cells treatments at the last measurment by two-way ANOVA followed by Turkey’s multiple comparisons test are indicated. d) HCT116 xenografts in NSG mice were treated with either control or SMAD4KO NK cells (2 × 10⁵). Tumor volume in each treatment group (n = 5 in NT and n = 6 in NK cell treated groups). e) HCT116-GFP + -Luc+ and HCC1954 GFP + -Luc+ spheroids were cultured with rIFNɣ, rIFN-β or rTNF. Mean ± SEM Luciferase activity of HCT116 nd HCC1954 spheroids after 24 h coculture. Statistical significance by one-way ANOVA followed by Turkey’s multiple comparisons test. Source data
Extended Data Fig. 8
Extended Data Fig. 8. Impact of SMAD4 and TGF-β in the integrin profile of expanded NK cells.
a) Surface expression of LFA-1 (CD11a and CD18), VLA-4 (CD49d and CD29) and CD103 in control and SMAD4KO NK cells treated with IL-2 ± TGF-β as analysed by flow cytometry. Representative histograms of each marker staining in NK cells from a representative individual. b) HCT116 spheroids were cocultured with control- or SMAD4KO NK cells previously treated with IL2 ± TGF-β. After 1 h coculture, spheroids and attached NK cells were fixed and processed for lightsheet imaging. HCT116 cells were labeled with an anti-Epcam-FITC antibody and NK cells with an anti-CD45-VioR667 antibody. Image of a representative HCT116 spheroid for the indicated conditions. Inset numbers correspond to the number of NK cells counted in each spheroid.
Extended Data Fig. 9
Extended Data Fig. 9. Influence of SMAD4 knock out on CAR19-NK, GTA002 and ADAPT-NK cell products exposed or not to TGF-β.
a-c) Mean ± SEM percentatge of NKG2D+, CD16+ and CD103+ control and SMAD4KO CAR19 NK cells in the indicated conditions d) Mean ± SEM percentatge of CD103+ control and SMAD4KO GTA002 cells in the indicated conditions. e-f) Mean ± SEM percentatge of NKG2D+, CD16+ and CD103+ control and SMAD4KO ADAPT-NK cells in the indicated conditions. Dots show data of independent experiments performed with NK cells from diferent donors. Statistical significance one-way ANOVA followed by Fisher’stest in A, B and C; and one-way ANOVA followed by Turkey’s multipe comparisons test in d-g. Source data

References

    1. Ruggeri, L. et al. Effectiveness of donor natural killer cell alloreactivity in mismatched hematopoietic transplants. Science295, 2097–2100 (2002). - PubMed
    1. Liu, E. et al. Use of CAR-transduced natural killer cells in CD19-positive lymphoid tumors. N. Engl. J. Med.382, 545–553 (2020). - PMC - PubMed
    1. Jia, L. et al. Sintilimab plus autologous NK cells as second-line treatment for advanced non-small-cell lung cancer previous treated with platinum-containing chemotherapy. Front. Immunol.13, 1074906 (2022). - PMC - PubMed
    1. Bae, W. K. et al. A phase I study of locoregional high-dose autologous natural killer cell therapy with hepatic arterial infusion chemotherapy in patients with locally advanced hepatocellular carcinoma. Front. Immunol.13, 879452 (2022). - PMC - PubMed
    1. Khatua, S. et al. Phase I study of intraventricular infusions of autologous ex vivo expanded NK cells in children with recurrent medulloblastoma and ependymoma. Neuro Oncol.22, 1214–1225 (2020). - PMC - PubMed

MeSH terms