. 2025 Mar 21;27(1):43.
doi: 10.1186/s13058-025-01966-2.

Evolutionary measures show that recurrence of DCIS is distinct from progression to breast cancer

Affiliations

Evolutionary measures show that recurrence of DCIS is distinct from progression to breast cancer

Angelo Fortunato et al. Breast Cancer Res. .

Abstract

Background: Progression from pre-cancers like ductal carcinoma in situ (DCIS) to invasive disease (cancer) is driven by somatic evolution and is altered by clinical interventions. We hypothesized that genetic and/or phenotypic intra-tumor heterogeneity would predict clinical outcomes for DCIS since it serves as the substrate for natural selection among cells.

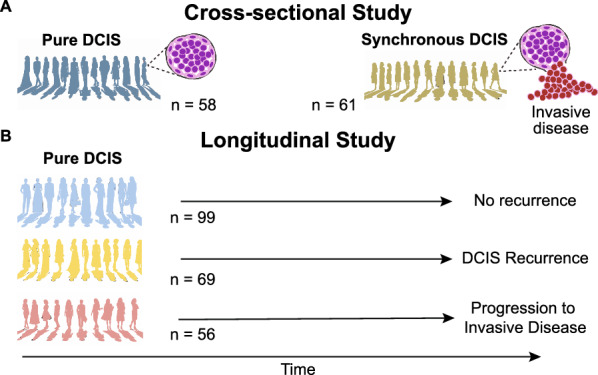
Methods: We profiled two samples from two geographically distinct foci from each DCIS in both cross-sectional (n = 119) and longitudinal cohorts (n = 224), with whole exome sequencing, low-pass whole genome sequencing, and a panel of immunohistochemical markers.

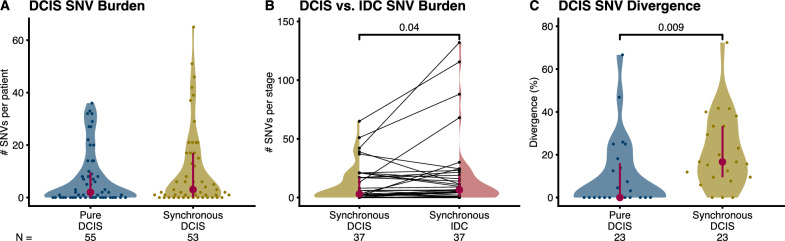
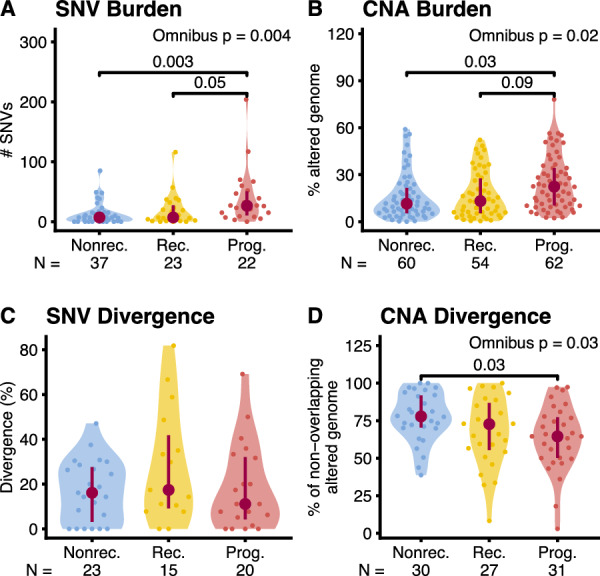
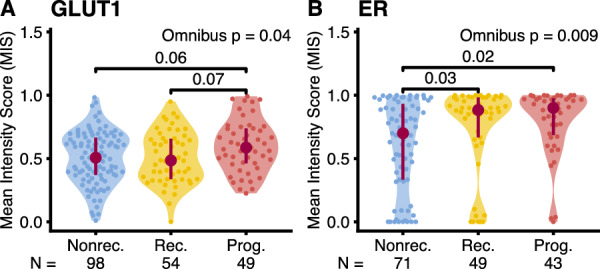
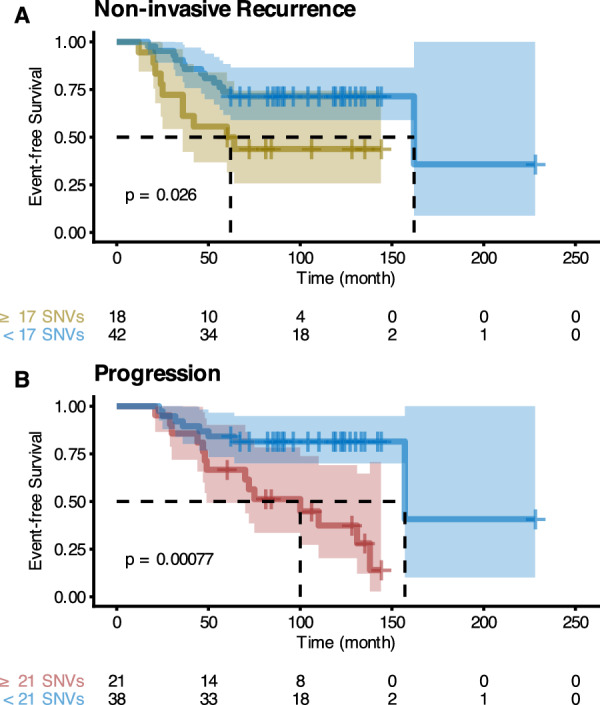
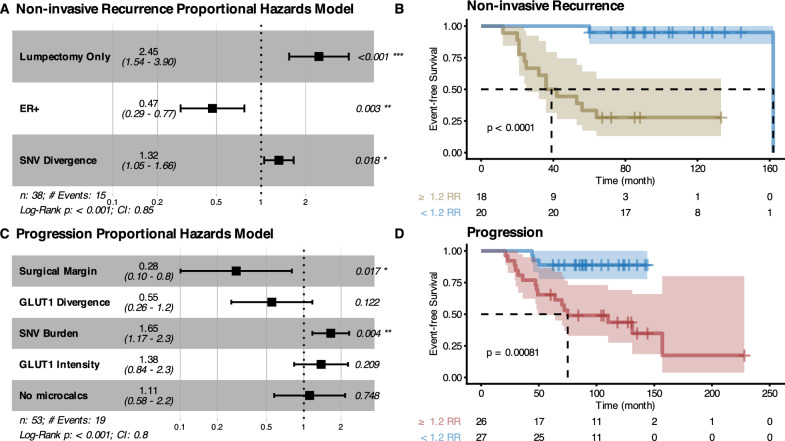
Results: In the longitudinal cohorts, the only statistically significant associations with time to non-invasive DCIS recurrence were the combination of treatment (lumpectomy only vs mastectomy or lumpectomy with radiation, HR 12.13, p = 0.003, Wald test with FDR correction), ER status (HR 0.16 for ER+ compared to ER-, p = 0.0045), and divergence in SNVs between the two samples (HR 1.33 per 10% divergence, p = 0.018). SNV divergence also distinguished between pure DCIS and DCIS synchronous with invasive disease in the cross-sectional cohort. In contrast, the only statistically significant associations with time to progression to invasive disease were the combination of the width of the surgical margin (HR 0.67 per mm, p = 0.043) and the number of mutations that were detectable at high allele frequencies (HR 1.30 per 10 SNVs, p = 0.02). No predictors were significantly associated with both DCIS recurrence and progression to invasive disease, suggesting that the evolutionary scenarios that lead to these clinical outcomes are markedly different.

Conclusions: These results imply that recurrence with DCIS is a clinical and biological process different from invasive progression.

Keywords: Breast cancer; Copy number alterations; Ductal carcinoma in situ; Evolutionary biomarkers; Intratumor heterogeneity; Invasive ductal carcinoma; Progression; Recurrence; Single nucleotide variants; Tumor evolution.


Conflict of interest statement

Declarations. Ethics approval and consent to participate: The Institutional Review Board (IRB) of Duke University Medical Center, as well as the IRB at each participating institution, approved this study, and a waiver of consent was obtained according to the approved protocol. Consent for publication: Not applicable. Competing interests: CC serves on the Scientific Advisory Board and/or as consultant for Bristol Myers Squibb, Deepcell, Genentech, NanoString, Ravel, Viosera, and holds equity in Deepcell, Illumina/Grail, and Ravel.

Figures

Fig. 1
Fig. 1
Schematic of the two study designs. A Cross-sectional study: Synchronous DCIS tumors are presumed to have evolved from pure DCIS that existed before the progression of the synchronous IDC. In patients with synchronous DCIS, only the DCIS component was sampled and assayed unless otherwise specified. B Longitudinal case–control study: pure-DCIS samples from patients treated and followed up for at least five years or until they progress or recur. n: number of patients per cohort
Fig. 2
Fig. 2
Cross-sectional SNV burden and divergence. Distribution of the number of SNVs per patient in the two cross-sectional cohorts A and the two lesion types (DCIS vs. IDC) present in the synchronous cohort B. Distribution of SNV genetic divergence (percentage of private mutations) per patient in the two cross-sectional cohorts C. We calculated divergence for tumors with at least five mutations in the union of the two samples, which explains the lower number of tumors per group. P-values shown if p ≤ 0.1, A, C Mann–Whitney U, B Paired-samples sign test. Interquartile range (vertical line) and median (point) in burgundy, N: number of patients
Fig. 3
Fig. 3
Cross-sectional phenotypic characterization and divergence. Distribution of mean intensity scores (MIS) per patient (see Methods) A, between-sample divergence (B, Earth Mover’s Distance [EMD]) and within-sample divergence (C, Cumulative Density Index [CDI]). A for each patient and IHC marker, B and C only markers with significant differences between cohorts (unadjusted p-values). Unadjusted pairwise Mann–Whitney U p-values shown if p ≤ 0.1. Interquartile range (vertical line) and median (point) in burgundy. N: number of patients
Fig. 4
Fig. 4
Longitudinal mutational burden and divergence. Distribution of SNV (A, C) and CNA (B, D) mutational burdens (A, B) and divergences (C, D) in the three longitudinal cohorts (Nonrec: nonrecurrents, Rec: recurrents, Prog: progressors). A: number of SNVs per patient; Omnibus test: Kruskal–Wallis Rank Sum, Post-hoc test: Dunn’s test with control for multiple tests using the Holm-Šidák adjustment. B: proportion of genome with copy number alterations per sample; Omnibus test: Mixed-effects ANOVA on the square-root-transformed proportion of genome altered, Post-hoc test: Tukey HSD on estimated marginal means. C: percentage of private SNV mutations per patient; Omnibus test: Kruskal–Wallis Rank Sum. D: percentage of the genome with copy number alterations private to either sample per patient; Omnibus test: ANOVA, Post-hoc test: Tukey HSD. P-values shown if adjusted p ≤ 0.1. Interquartile range (vertical line) and median (point) in burgundy, N: number of data points (A, C, and D: patients, B: samples). We only calculated divergence for tumors with at least five mutations in the union of the two samples, which explains the lower number of tumors in C
Fig. 5
Fig. 5
Longitudinal phenotypic characterization. Distribution of mean normalized intensities (MIS) per patient (see Methods) in the three longitudinal cohorts (Nonrec: nonrecurrents, Rec: recurrents, Prog: progressors). A: GLUT1 marker, B: ER marker in ER + patients only (where ER status was taken from the clinical records). Omnibus test: Kruskal–Wallis Rank Sum, Post-hoc test: Dunn’s test with control for multiple tests using the Holm-Šidák adjustment. P-values shown if adjusted p ≤ 0.1. Interquartile range (vertical line) and median (point) in burgundy. N: number of patients
Fig. 6
Fig. 6
Event-free survival curves of patients stratified by SNV burden. Kaplan–Meier plots of stratified patients. A Non-invasive-recurrence-free survival. B Progression-free survival. SNV burden thresholds maximize Youden’s J statistic of the outcomes (17 SNVs for non-invasive recurrence and 21 for progression). Log-rank test. The table below the Kaplan–Meier plot shows the number of samples at risk at different times
Fig. 7
Fig. 7
Associations with time to clinical outcome. Forest plots describing proportional hazard regressions using variables selected with LASSO (A, C) and corresponding Kaplan–Meier plots of patients stratified by the relative risk threshold that maximizes Youden’s J statistic of the outcomes (B, D). A and B Non-invasive-recurrence-free survival. C and D Progression-free survival. Hazard Ratios (second column, A, C) are relative to 1 standard deviation. Lumpectomy Only is compared to Lumpectomy + Radiation and Mastectomy and ER+ is compared to ER-. No microcalc(ification)s is compared to having microcalcifications in DCIS-only and/or benign ducts. Tables below Kaplan–Meier plots show the number of samples at risk at different times. Log-rank test

Update of

Similar articles

Cited by

References

    1. Rosenberg RD, Seidenwurm D. Optimizing breast cancer screening programs: experience and structures. Radiology. 2019;292:297–8. - PubMed
    1. Ozanne EM, Shieh Y, Barnes J, Bouzan C, Hwang ES, Esserman LJ. Characterizing the impact of 25 years of DCIS treatment. Breast Cancer Res Treat. 2011;129:165–73. - PubMed
    1. Maxwell AJ, Clements K, Hilton B, Dodwell DJ, Evans A, Kearins O, et al. Risk factors for the development of invasive cancer in unresected ductal carcinoma in situ. Eur J Surg Oncol. 2018;44:429–35. - PubMed
    1. Esserman LJ, Thompson IM, Reid B, Nelson P, Ransohoff DF, Welch HG, et al. Addressing overdiagnosis and overtreatment in cancer: a prescription for change. Lancet Oncol. 2014;15:e234–42. - PMC - PubMed
    1. Hwang ES, Hyslop T, Lynch T, Frank E, Pinto D, Basila D, et al. The COMET (Comparison of operative versus monitoring and endocrine therapy) trial: a phase III randomised controlled clinical trial for low-risk ductal carcinoma in situ (DCIS). BMJ Open. 2019;9: e026797. - PMC - PubMed

MeSH terms

Substances

LinkOut - more resources