. 2025 Jun 1;214(6):1202-1218.
doi: 10.1093/jimmun/vkaf020.

Galectin-3 regulates erythropoiesis and enhances the immunoregulatory properties of CD71+ erythroid cells across developmental stages

Affiliations

Galectin-3 regulates erythropoiesis and enhances the immunoregulatory properties of CD71+ erythroid cells across developmental stages

Shokrollah Elahi et al. J Immunol. .

Abstract

Galectins are expressed by different immune and nonimmune cells with diverse immunomodulatory properties. However, their roles in erythropoiesis remain unknown. We investigated the expression of galectin genes in splenic CD71+ erythroid cells (CECs) from neonatal BALB/c mice at various developmental stages using bulk RNA sequencing. Our analysis revealed distinct gene expression profiles at different ages. Specifically, CECs from day-3 mice had a markedly different expression pattern compared to those from days 6, 12, and 28. Notably, Lgals1, Lgals3, Lgals4, Lgals8, and Lgals9 were constitutively expressed in CECs, with galectin-3 (Gal-3) showing predominant surface expression, unlike Gal-1 and Gal-9. Further analysis revealed that Gal-3+ CECs exhibited elevated levels of TGF-β, ROS, arginase I, VISTA, and PD-L1, correlating with enhanced immunosuppressive functions. These cells also demonstrated increased CD45, c-kit, Ki67, and p21 levels, indicating heightened proliferative activity despite showing increased apoptosis. Moreover, we found that Gal-3+ CECs displayed enhanced activation of signaling pathways, including STAT5, MAPK, and LCK. Additionally, Gal-3+ CECs co-expressed Fas and FasL, implicating these molecules in the regulation of early erythroblasts. Notably, Gal-3 interacted with CD71 and GARP, influencing CECs' immunoregulatory roles. In tissue-specific studies, we found varying frequencies of Gal-3+ CECs across the spleen, liver, and bone marrow (BM), with notable variations in the placenta and fetal liver. These results were paralleled in human BM-derived CECs, which also exhibited high Gal-3 levels. Our findings emphasize the critical role of Gal-3 in modulating erythropoiesis and suggest that Gal-3+ CECs possess enhanced immunoregulatory capacities.

Keywords: GARP; erythroid progenitors; galectin-1; galectin-9; transferrin receptor.


Conflict of interest statement

The authors declare no conflict of interests exist.

Figures

None
Graphical abstract
Figure 1.
Figure 1.
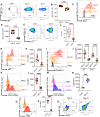
Gene expression characteristic of CECs. (A) Hierarchical clustering on Euclidian distances showing different gene expression profiles in CECs from different ages. (B) PCA on the Euclidian distances between CECs in different ages. (C) The heat map of galectins genes is shown. (Lgals1 [Gal-1]).
Figure 2.
Figure 2.
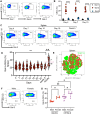
Gal-3 is the most abundant galectin present on the surface of CECs. (A) Representative flow cytometry plots, and (B) cumulative data of the frequency of Gal-1-expressing, Gal-3-expressing, and Gal-9-expressing CECs in the spleen of neonatal mice (n = 10) at indicated ages. (C) Representative flow cytometry plots, and (D) cumulative data of the frequency of Gal-3-expressing-in-the-spleen CECs of neonatal (n = 15 to 30), 5-week-old (n = 5), and adult mice (n = 10) at indicated ages. The line separates female (F) and male (M) mice. (E) tSNE plot illustrates TER119- expressing and Gal-3-expressing CECs. (F) Representative flow cytometry plots, and (G) cumulative data of the frequency of Gal-3-expressing CECs in the spleen from adult male and female BALB/c and C58BL/6 mice. Each dot represents a mouse. **P ≤ 0.01, **P ≤ 0.01, ns, not significant.
Figure 3.
Figure 3.
Differential frequency of Gal-3-expressing CECs in different tissues/organs. (A) Representative flow cytometry plots, and (B) cumulative data of the frequency of Gal-3-expressing CECs from the spleen and BM of 7-day-old neonatal mice (n = 15). (C) tSNE plot illustrates Gal-3-expressing CECs. (D) Representative flow cytometry plots, and (E) cumulative data of the frequency of Gal-3-expressing CECs from the spleen and liver of 7-day-old neonatal mice (n = 12). (F) Representative flow cytometry plots, (G) cumulative data of the frequency of Gal-3-expressing and Gal-9-expressing CECs in the fetal liver, and (H) neonatal intestinal tissues. (I) Representative flow cytometry plots, and (J) cumulative data of the frequency of Gal-3-expressing and Gal-9-expressing CECs in the spleen of pregnant mice. (K) Representative flow cytometry plots, and (L) cumulative data of the frequency of Gal-3-expressing and Gal-9-expressing CECs in the placental tissues of mice. Each dot represents a mouse. *P < 0.5, **P ≤ 0.01, ***P ≤ 0.001, and ****P ≤ 0.0001. FMO, fluorescence minus one.
Figure 4.
Figure 4.
CD45+ CECs are enriched of Gal-3 expression. (A) Representative flow cytometry plots, and (B) cumulative data comparing the frequency of Gal-3-expressing CECs at the surface, ICS, and INS levels in CECs from 7-day-old mice (n = 7). (C) Representative flow cytometry plots, and (D) cumulative data comparing the frequency of Gal-9-expressing CECs at the surface, ICS, and INS levels in CECs from 7-day-old mice (n = 7). (E) Representative flow cytometry plots and the gating strategy for the frequency of Gal-3+ among CD45+ and CD45– CECs from a spleen of 7-day-old mouse. (F) Cumulative data of the frequency of Gal-3-expressing cells among CD45+ and CD45– CECs of 7-day-old mice (n = 10). (G) Representative flow cytometry plots, and (H) cumulative data comparing the frequency of Gal-3+ and Gal-3– CECs among CD45+ CECs from 7-day-old mice (n = 10). (I) tSNE plot illustrates CD45-expressing CECs. Each dot represents a study subject. **P ≤ 0.01, ***P ≤ 0.001, and ****P ≤ 0.0001. FMO, fluorescence minus one.
Figure 5.
Figure 5.
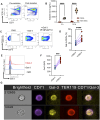
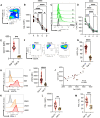
Gal-3 is colocalized with CD71 on the surface of CECs. (A) Representative flow cytometry plots of pre– and-post–CEC enrichment. (B) Cumulative data of detected concentrations of Gal-3 in culture supernatants of isolated CECs versus other immune cell lineages (non-CECs) at 3 and 6 h postculture as quantified by ELISA. (C) Representative flow cytometry plots, and (D) cumulative data of the frequency of Gal-3-expressing CECs in the absence of recombinant Gal-3 (-rGal-3) or presence of rGal-3 (+rGal-3) for 3 h at 1 µg/ml before analysis. (E) Representative flow cytometry plots, and (F) cumulative data of the intensity of Gal-3 expression among CECs in the absence of recombinant Gal-3 (-rGal-3) or presence of rGal-3 (+rGal-3) for 3 h at 1 µg/ml before analysis. (G) Colocalization of CD71 and Gal-3 on CECs quantified using an Amnis ImageStream platform. Each dot represents data from a mouse. ***P ≤ 0.001, and ****P ≤ 0.0001. FMO, fluorescence minus one.
Figure 6.
Figure 6.
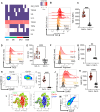
Gal-3+ CECs express higher levels of markers associated with enhanced immunoregulatory properties of CECs. (A) The heat map from the bulk RNAseq analysis represents the expression level of different cytokine/chemokine genes in total CECs from mice at indicated ages. (B) Representative flow cytometry plots, and (C) cumulative data present TGF-β expression among Gal-3+ versus Gal-3– CECs from the spleen of neonatal mice. (D) Representative flow cytometry plots, and (E) cumulative data present ROS expression among Gal-3+ versus Gal-3– CECs from the spleen of neonatal mice. (F) Representative flow cytometry plots, and (G) cumulative data present arginase I expression among Gal-3+ versus Gal-3– CECs from the spleen of neonatal mice. (H) Representative flow cytometry plots, and (I) cumulative data of the proportion of GARP-expressing cells among Gal-3–/Gal-3+ CECs from the spleen of neonatal mice (n = 9). (J) Representative flow cytometry plots, and (K) cumulative data of the intensity of GARP expression among Gal-3–/Gal-3+ CECs from the spleen of neonatal mice. (L) tSNE plots illustrate Gal-3 and GARP-expressing CECs. (M) Representative flow plot shows the co-expression of Gal-3 and GARP in splenic CECs of a neonatal mouse. Each dot represents a study subject. **P ≤ 0.01, ***P ≤ 0.001, and ****P ≤ 0.0001. FMO, fluorescence minus one; MFI, mean fluorescence intensity.
Figure 7.
Figure 7.
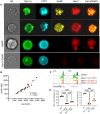
Gal-3+ CECs display robust immunosuppression. (A) Colocalization of GARP and Gal-3 on CECs quantified using an Amnis ImageStream platform. (B) Pearson correlation between the intensity of GARP expression and Gal-3 in CECs. (C) Representative flow cytometry, and (D) cumulative data of CD4+ and CD8+ T-cell proliferation as measured by CFSE in the presence of Gal-3+ or Gal-3– CECs at 1:2 T-cell/CEC ratio. T cells were stimulated (stim) with anti-CD3/CD28 for 3 days before analysis. Each dot represents data from an experiment/mouse. ***P ≤ 0.001, and ****P ≤ 0.0001. BF, Bright field; MFI, mean fluorescence intensity; unstim, unstimulated control.
Figure 8.
Figure 8.
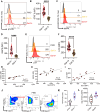
Gal-3-expressing CECs exhibit higher proliferative capacity and apoptotic potential. (A) Representative flow cytometry plots, and (B) cumulative data of the frequency of Ki67-expressing cells among Gal-3+ and Gal-3– CECs. (C) Representative flow cytometry plots, and (D) cumulative data of the intensity of Ki67 expression among Gal-3+ and Gal-3– CECs. (E) Representative flow cytometry plots, and (F) cumulative data of the frequency of p21-expressing cells among Gal-3+ and Gal-3– CECs. (G) Representative flow cytometry plots, and (H) cumulative data of the intensity of p21 expression among Gal-3+ and Gal-3– CECs. (I) Representative flow cytometry plots, and (J) cumulative data of the intensity of Annexin V expression among Gal-3– and Gal-3+ CECs from the spleen of day-7 and day-10 mice. (K) Representative flow cytometry plots, and (L) cumulative data of the intensity of FAS expression among Gal-3– and Gal-3+ CECs. (M) Representative flow cytometry plots, and (N) cumulative data of the intensity of FAS expression among CD45– and CD45+ CECs. (O) Representative flow cytometry plots, and (P) cumulative data of the intensity of FASL expression among Gal-3– and Gal-3+ CECs. (Q) Representative flow cytometry plot of the co-expression of FAS and FASL in Gal-3– and Gal-3+ CECs. Each dot represents data from an experiment/mouse. ***P ≤ 0.001, and ****P ≤ 0.0001. FMO, fluorescence minus one.
Figure 9.
Figure 9.
Gal-3+ CECs express higher levels of VISTA and PDL-1. (A) Representative flow cytometry plot, and (B) cumulative data of the intensity of Gal-3 expression among CEC subsets. (C) Representative flow cytometry plot, and (D) cumulative data of the intensity of c-kit expression among CEC subsets, such as CD71hiTER119lo (A), CD71hiTER119+ (B), CD71midTER119+ (C), CD71loTER119+ (D). (E) Cumulative data of the intensity of c-kit (CD117) expression among Gal-3+ and Gal-3– splenic CECs. (F) Representative flow cytometry plots, and (G) cumulative data of the percentages of VISTA+ cells among Gal-3+ and Gal-3– splenic CECs. (H) Representative flow cytometry plots, and (I) cumulative data of VISTA expression intensity (MFI) among Gal-3+ and Gal-3– splenic CECs. (J) Pearson correlation between the intensity of VISTA expression and Gal-3 in splenic CECs. (K) Representative flow cytometry plots, and (L) cumulative data of PDL-1 expression intensity (MFI) among Gal-3+ and Gal-3– splenic CECs. (M) Cumulative data of the percentages of PDL-1+ cells among Gal-3+ and Gal-3– splenic CECs. *P < 0.5, **P ≤ 0.01, ***P ≤ 0.001, and ****P ≤ 0.0001. FMO, fluorescence minus one; MFI, mean fluorescence intensity; ns, not significant.
Figure 10.
Figure 10.
Gal-3+ possess higher levels of phospho-STAT5, LCK, and MAPK than their negative counterparts. (A) Representative flow cytometry plots, and (B) cumulative data of the intensity of phospho-STAT5 expression among Gal-3– and Gal-3+ CECs. (C) Representative flow cytometry plots, and (D) cumulative data of the intensity of phospho-MAPK expression among Gal-3– and Gal-3+ CECs. (E) Representative flow cytometry plots, and (F) cumulative data of the intensity of phospho-LCK expression among Gal-3– and Gal-3+ CECs. (G) Pearson correlation between Gal-3 expression intensity and the expression levels of STAT5, (H) MAPK, and (I) LCK among CECs. (J) Representative flow cytometry, and (K) cumulative data showing the proportion of Gal-3+ CECs among CD45– and CD45+ CECs from human BM samples. (L) Cumulative data of the intensity of the Gal-3 expression among CD45– and CD45+ CECs from human BM. Each dot represents data from an experiment/mouse or human subject. ***P ≤ 0.001. FMO, fluorescence minus one.

Similar articles

References

    1. Zivot A, Lipton JM, Narla A, Blanc L. Erythropoiesis: insights into pathophysiology and treatments in 2017. Mol Med. 2018;24:11. - PMC - PubMed
    1. Valent P et al. Normal and pathological erythropoiesis in adults: from gene regulation to targeted treatment concepts. Haematologica. 2018;103:1593–1603. - PMC - PubMed
    1. Elahi S. New insight into an old concept: role of immature erythroid cells in immune pathogenesis of neonatal infection. Front Immunol. 2014;5:376. - PMC - PubMed
    1. Elahi S, Mashhouri S. Immunological consequences of extramedullary erythropoiesis: immunoregulatory functions of CD71(+) erythroid cells. Haematologica. 2020;105:1478–1483. - PMC - PubMed
    1. Elahi S. Neglected cells: immunomodulatory roles of CD71(+) erythroid cells. Trends Immunol. 2019;40:181–185. - PubMed