. 2025 Jan-Dec:39:3946320251328476.
doi: 10.1177/03946320251328476. Epub 2025 Mar 22.

Interleukin expression patterns and immune cell infiltration in prostate adenocarcinoma: Implications for recurrence risk

Affiliations

Interleukin expression patterns and immune cell infiltration in prostate adenocarcinoma: Implications for recurrence risk

Jialong Zhang et al. Int J Immunopathol Pharmacol. 2025 Jan-Dec.

Abstract

Objective: This study aims to comprehensively investigate the expression profiles of interleukins in prostate adenocarcinoma (PRAD) and their relationship with immune cell infiltration, tumor progression, and patient prognosis. By establishing an interleukin-related risk score, we seek to enhance the understanding of the tumor immune microenvironment and facilitate the development of tailored immunotherapeutic strategies for PRAD patients.

Introduction: Interleukins can nurture a tumor promoting environment and simultaneously regulate immune cell infiltration. However, the potential roles of interleukins in the prostate adenocarcinoma immune landscape remain abstruse.

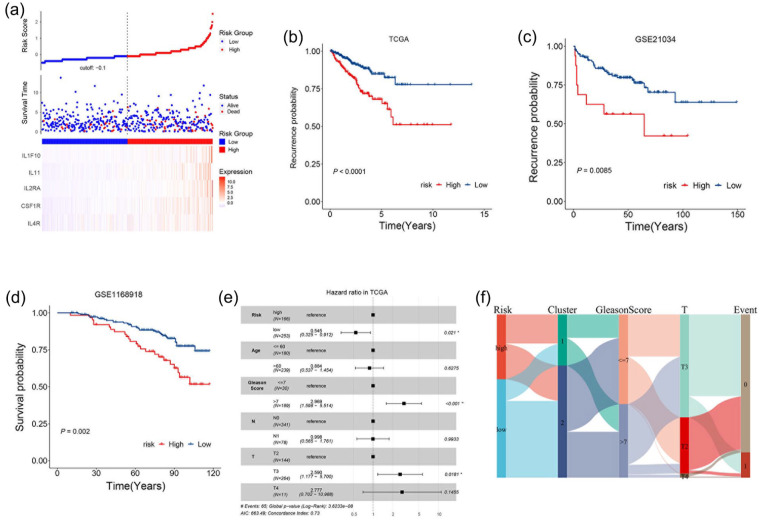
Methods: We comprehensively investigated the interleukin expression patterns and tumor immune landscape of prostate adenocarcinoma patients. And explored the interleukin expression patterns with immune infiltration landscape. The interleukin score was established using LASSO cox regression analysis. Multivariate Cox regression analysis was employed to assess the prognostic value of the interleukin score.

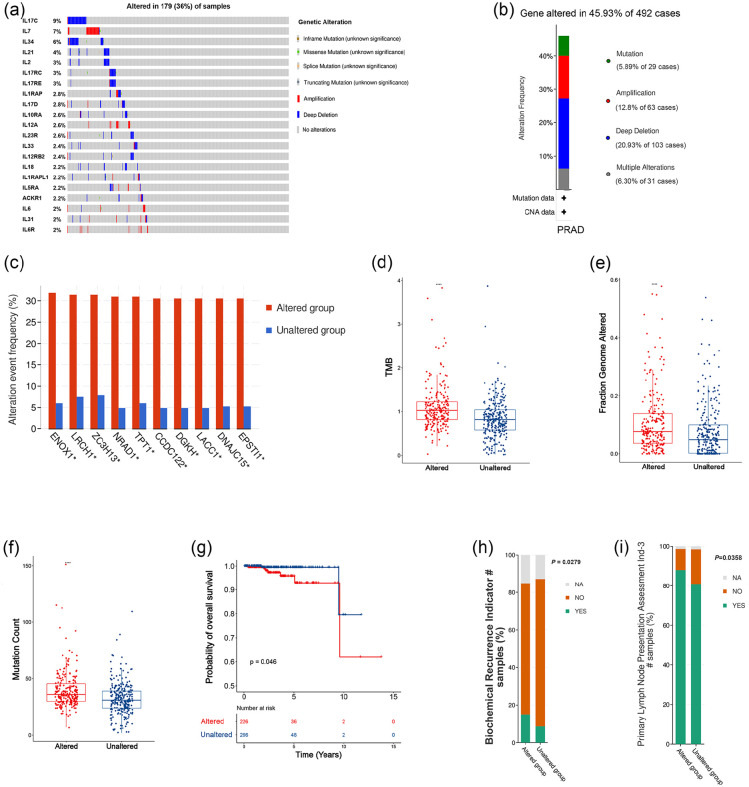
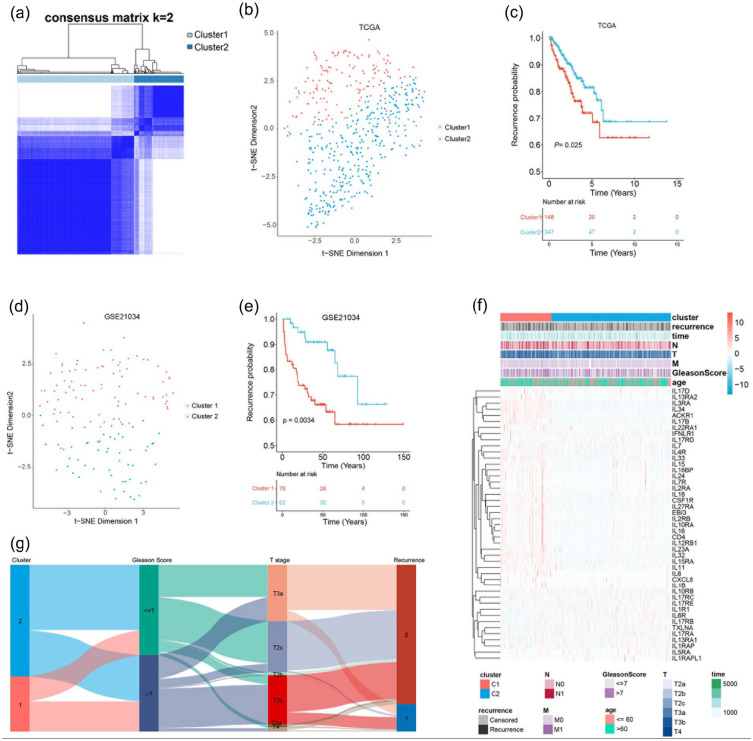
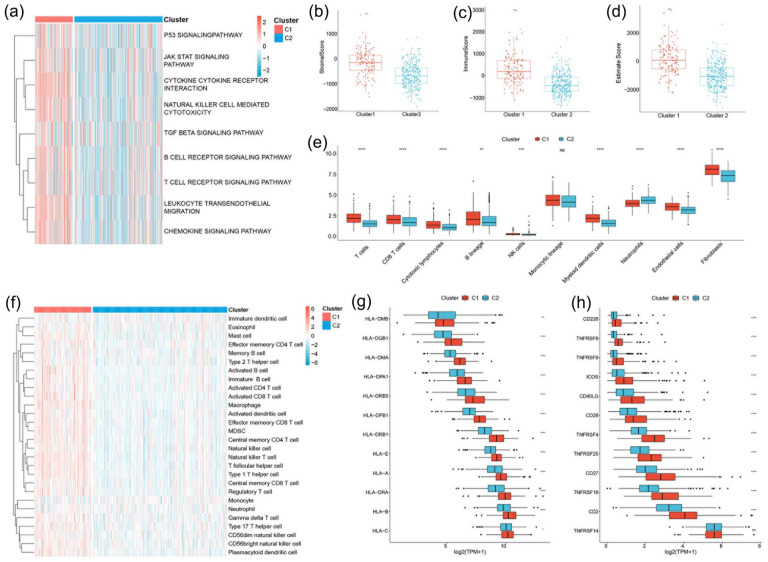
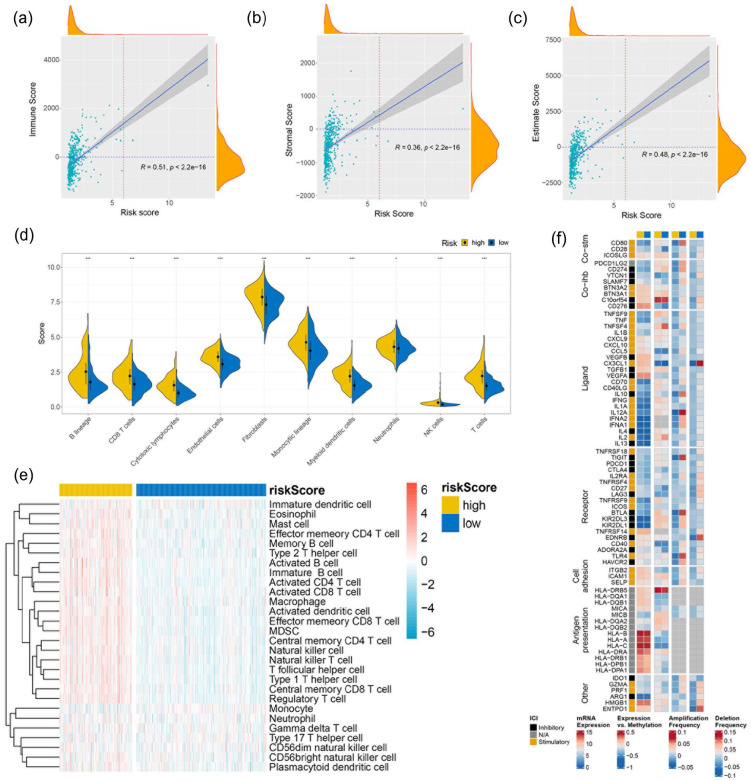
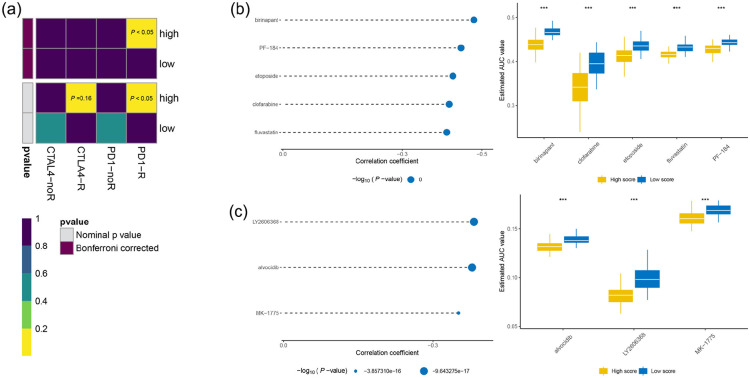
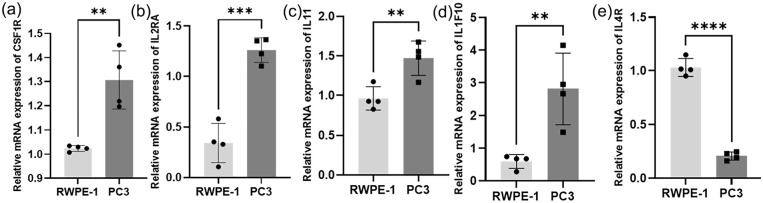
Results: We identified two distinct interleukin clusters, characterized by different immune cell infiltration, tumor promoting signaling pathways activation and prognosis. The interleukin score was established to estimate the prognosis of individual prostate adenocarcinoma (PRAD) patient. Further analysis demonstrated that the interleukin score was an independent prognostic factor of PRAD. Finally, we investigated the predictive value of interleukin score in the programmed cell death protein (PD-1) blockade therapy of patients with prostate adenocarcinoma. At the same time, the differences in related genes among different prostate cell lines were also identified.

Conclusions: This study demonstrated the correlation between interleukin and tumor immune landscape in prostate adenocarcinoma. The comprehensive evaluation of interleukin expression patterns in individual prostate patients contribute to our understanding of the immune landscape and helps clinicians selecting proper immunotherapy strategies for prostate patients.

Keywords: drug selection; immune cell infiltration; immunotherapies; interleukin; prognostic signature; prostate adenocarcinoma.


Conflict of interest statement

Declaration of conflicting interestsThe author(s) declared no potential conflicts of interest with respect to the research, authorship, and/or publication of this article.

Figures

Figure 1.
Figure 1.
The alternations of interleukins in PRAD. (a) Landscape of genomic alternations of the interleukins in PRAD. Each row represents a gene, and each column represents a patient. The frequency of alternations in top 20 interleukins. (b) Gene alternation frequency of PRAD patients in TCGA. (c) Histogram of the proportion of different mutation modes in PRAD. (d–f) The difference of TMB, fraction genome altered frequency and mutation count between altered and unaltered cohort. (g) The overall survival of PRAD patient between altered and unaltered cohort. (h) Histogram of the frequency of biochemical recurrence in altered and unaltered cohort. (i) Histogram of the frequency of primary lymph node presentation in altered and unaltered cohort.
Figure 2.
Figure 2.
Consensus clustering of interleukins in PRAD. (a) Consensus matrices of patients in the TCGA cohort for k = 1 using 100 iterations of unsupervised consensus clustering method (K-means) to ensure the clustering stability. (b) t-SNE analysis of interleukin related subtypes in TCGA cohort. (c) Comparison of prognosis of patients in different PRAD subtypes in TCGA cohort. (d) t-SNE analysis of interleukin related subtypes in GSE21034. (e) Comparison of prognosis of patients in different PRAD subtypes in GSE21034. (f) Heatmap of interleukin in TCGA cohorts. Interleukin related cluster, recurrence status, overall survival time, N stage, T stage, M stage, Gleason score, and age were used as patient annotations. (g) Sankey plot summarized the relationship among the cluster, Gleason score, T stage, and recurrence status.
Figure 3.
Figure 3.
Biological characteristics and immune landscape of interleukin subtypes in the TCGA cohort. (a) Heatmap of the activation status of biological process in different subtypes evaluated by GSVA. Red and blue represents the activation and inhibition of biological process respectively. (b–d) The difference of stromal score, immune score and estimate score in two interleukin subtypes. (e) The difference of immune cell infiltration between two interleukin subtypes evaluated by MCP-counter. (f) The immune cell infiltration landscape between two interleukin subtypes calculated using ssGASEA. (g–h) Gene expression of HLA and MHC gene sets between two interleukin subtypes. Statistical significance at the level of ns ⩾0.05, *<0.05, **<0.01, ***<0.001, and ****<0.0001.
Figure 4.
Figure 4.
Construction of interleukin related score. (a) The distribution of risk score, recurrence status, and hub gene expression level. (b–d) Kaplan-Meier curves for patients with high or low interleukin score in the TCGA, GSE21034, and GSE1168918. (e) Multivariate cox regression analysis of interleukin core and other clinical characteristics. (f) Sankey plot summarized the relationship among the risk core, cluster, Gleason score, T stage, and recurrence status.
Figure 5.
Figure 5.
Relationship between risk score and immune cell infiltration. (a) The correlation between risk core and immune score in TCGA cohort. (b) The correlation between risk score and stromal score in TCGA cohort. (c) The correlation between risk score and estimate score in TCGA cohort. (d) The difference of immune cell infiltration level in high and low risk cohort identified by MCP-counter analysis. (e) The immune cell landscape in high and low risk cohort evaluated by ssGSEA. (f) Regulation of immunomodulators in high and low risk cohort. From left to right: mRNA expression (median normalized expression levels); expression versus methylation (gene expression correlation with DNA-methylation beta value); amplification frequency (the difference between the fraction of samples in which an immunomodulator is amplified in a particular subtype and the amplification fraction in all samples); and the deletion frequency (as amplifications) 75 IM by interleukin score.
Figure 6.
Figure 6.
Enrichment analysis of highly expressed genes in the high interleukin score cohort. (a) Cellular Component. (b) Biological process. (c) Molecular function.
Figure 7.
Figure 7.
Association between interleukin score and mutations. (a–b) Oncoprint of mutation status of top 20 genes in high (a) and low (b) risk cohort. (c–d) The tumor mutation burden (c) and fraction genome altered (d) in high and low risk cohort. (e) Focal and broad copy number alternations among the high and low risk cohort. Statistical significance at the level of ns ⩾0.05, *<0.05, **<0.01, ***<0.001, and ****<0.0001.
Figure 8.
Figure 8.
Immunotherapy response prediction and identification of candidate agents with higher drug sensitivity in high interleukin score patients. (a) The response of high and low interleukin score patients to PD-1 and CTLA-4 immunotherapy. (b) The results of Spearman correlation analysis and differential drug response analysis of five CTRP derived compounds. (c) The results of Spearman correlation analysis and differential drug response analysis of three PRISM derived compounds.
Figure 9.
Figure 9.
The mRNA expression levels of CSF1R (a), IL2RA (b), IL11 (c), IL1F10 (d) and IL4R (e) in different cell lines (RWPE-1 and PC3) were measured by RT-qPCR. Results were normalized to reference gene ACTIN. Data are shown as the mean ± SEM, two-tailed unpaired t test was used for statistical calculation for each marker, n = 4 independent experiments. ns: not significant. *p < 0.05. **p < 0.01. ***p < 0.001.

Similar articles

References

    1. Rawla P. (2019) Epidemiology of prostate cancer. World Journal of Oncology 10(2): 63–89. - PMC - PubMed
    1. Siegel RL, Miller KD, Jemal A. (2017) Cancer statistics, 2017. CA: A Cancer Journal for Clinicians 67(1): 7–30. - PubMed
    1. Litwin MS, Tan HJ. (2017) The diagnosis and treatment of prostate cancer: A review. JAMA 317(24): 2532–2542. - PubMed
    1. Beltran H, Rickman DS, Park K, et al. (2011) Molecular characterization of neuroendocrine prostate cancer and identification of new drug targets. Cancer Discovery 1(6): 487–495. - PMC - PubMed
    1. Chang AJ, Autio KA, Roach M, 3rd, et al. (2014) High-risk prostate cancer-classification and therapy. Nature Reviews Clinical Oncology 11(6): 308–323. - PMC - PubMed

MeSH terms

LinkOut - more resources