

CytoSimplex: visualizing single-cell fates and transitions on a simplex
- PMID: 40119904
- PMCID: PMC11992338
- DOI: 10.1093/bioinformatics/btaf119
CytoSimplex: visualizing single-cell fates and transitions on a simplex
Abstract
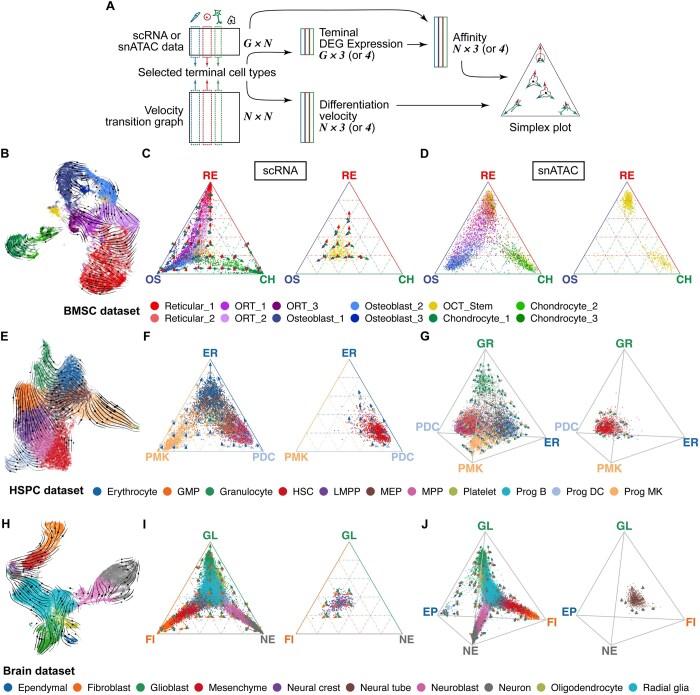
Summary: Cells differentiate to their final fates along unique trajectories, often involving multi-potent progenitors that can produce multiple terminally differentiated cell types. Recent developments in single-cell transcriptomic and epigenomic measurement provide tremendous opportunities for mapping these trajectories. The visualization of single-cell data often relies on dimension reduction methods such as UMAP to simplify high-dimensional single-cell data down to an understandable 2D form. However, these dimension reduction methods are not constructed to allow direct interpretation of the reduced dimensions in terms of cell differentiation. To address these limitations, we developed a new approach that places each cell from a single-cell dataset within a simplex whose vertices correspond to terminally differentiated cell types. Our approach can quantify and visualize current cell fate commitment and future cell potential. We developed CytoSimplex, a standalone open-source package implemented in R and Python that provides simple and intuitive visualizations of cell differentiation in 2D ternary and 3D quaternary plots. We believe that CytoSimplex can help researchers gain a better understanding of cell type transitions in specific tissues and characterize developmental processes.
Availability and implementation: The R version of CytoSimplex is available on Github at https://github.com/welch-lab/CytoSimplex. The Python version of CytoSimplex is available on Github at https://github.com/welch-lab/pyCytoSimplex.
© The Author(s) 2025. Published by Oxford University Press.
Figures
Similar articles
-
Efficient cytometry analysis with FlowSOM in Python boosts interoperability with other single-cell tools.Bioinformatics. 2024 Mar 29;40(4):btae179. doi: 10.1093/bioinformatics/btae179. Bioinformatics. 2024. PMID: 38632080 Free PMC article.
-
easySCF: a tool for enhancing interoperability between R and Python for efficient single-cell data analysis.Bioinformatics. 2024 Nov 28;40(12):btae710. doi: 10.1093/bioinformatics/btae710. Bioinformatics. 2024. PMID: 39585309 Free PMC article.
-
tagtango: an application to compare single-cell annotations.Bioinformatics. 2025 Feb 4;41(2):btaf012. doi: 10.1093/bioinformatics/btaf012. Bioinformatics. 2025. PMID: 39798134 Free PMC article.
-
Cerebro: interactive visualization of scRNA-seq data.Bioinformatics. 2020 Apr 1;36(7):2311-2313. doi: 10.1093/bioinformatics/btz877. Bioinformatics. 2020. PMID: 31764967 Free PMC article.
-
Concepts and limitations for learning developmental trajectories from single cell genomics.Development. 2019 Jun 27;146(12):dev170506. doi: 10.1242/dev.170506. Development. 2019. PMID: 31249007 Review.
References
-
- Aitchison J. The statistical analysis of compositional data. J R Stat Soc Ser B Stat Methodol 1982;44:139–60.
-
- Bergen V, Lange M, Peidli S et al. Generalizing RNA velocity to transient cell states through dynamical modeling. Nat Biotechnol 2020;38:1408–14. - PubMed
MeSH terms
Grants and funding
LinkOut - more resources
Full Text Sources
Miscellaneous
