. 2025 Sep 3;148(9):3407-3421.
doi: 10.1093/brain/awaf109.

ADAT3 variants disrupt the activity of the ADAT tRNA deaminase complex and impair neuronal migration

Jordi Del-Pozo-Rodriguez  1   2   3   4 Peggy Tilly  1   2   3   4 Romain Lecat  1   2   3   4 Hugo Rolando Vaca  1   2   3   4 Laureline Mosser  5 Elena Brivio  1   2   3   4 Till Balla  6 Marina Vitoria Gomes  1   2   3   4 Elizabeth Ramos-Morales  1   2   3   4 Noémie Schwaller  1   2   3   4 Thalia Salinas-Giegé  5 Grace VanNoy  7 Eleina M England  7 Alysia Kern Lovgren  7 Melanie O'Leary  7 Maya Chopra  8   9 Naomi Meave Ojeda  10   11 Mehran Beiraghi Toosi  12 Atieh Eslahi  13 Masoome Alerasool  13   14 Majid Mojarrad  13   14 Lynn S Pais  7   15 Rebecca C Yeh  15 Dustin L Gable  16 Mais O Hashem  17 Firdous Abdulwahab  17 Muath Rakiz Alqurashi  18 Loai Z Sbeih  19 Omar Abu Adas Blanco  19 Renad Abu Khater  19 Gabriela Oprea  20 Aboulfazl Rad  20 Hamad Alzaidan  21 Hesham Aldhalaan  22 Ehab Tous  22 Afaf Alsagheir  23   24 Mohammed Alowain  21   24 Abdullah Tamim  25 Khowlah Alfayez  26 Amal Alhashem  24   27   28 Aisha Alnuzha  29 Mona Kamel  29   30 Bashayer S Al-Awam  31 Walaa Elnaggar  30 Nihal Almenabawy  30 Anne O'Donnell-Luria  7   15 Jennifer E Neil  15   32 Joseph G Gleeson  10   11 Christopher A Walsh  15   32   33 Fowzan S Alkuraya  17   34 Lama AlAbdi  17 Nour Elkhateeb  30   35 Laila Selim  30 Siddharth Srivastava  8   9 Danny D Nedialkova  6   36 Laurence Drouard  5 Christophe Romier  1   2   3   4 Efil Bayam  1   2   3   4 Juliette D Godin  1   2   3   4
Affiliations

ADAT3 variants disrupt the activity of the ADAT tRNA deaminase complex and impair neuronal migration

Jordi Del-Pozo-Rodriguez et al. Brain. .

Abstract

The ADAT2/ADAT3 (ADAT) complex catalyses the adenosine to inosine modification at the wobble position of eukaryotic tRNAs. Mutations in ADAT3, the catalytically inactive subunit of the ADAT2/ADAT3 complex, have been identified in patients presenting with severe neurodevelopmental disorders. Yet, the physiological function of the ADAT2/ADAT3 complex during brain development remains totally unknown. Here, we investigated the role of the ADAT2/ADAT3 complex in cortical development. First, we report 21 neurodevelopmental disorders patients carrying biallelic variants in ADAT3. Second, we used structural, biochemical and enzymatic assays to deeply characterize the impact of those variants on the ADAT2/ADAT3 structure, biochemical properties, enzymatic activity, and tRNAs editing and abundance. Finally, in vivo complementation assays were performed to correlate functional deficits with neuronal migration defects in the developing mouse cortex. Our results showed that maintaining a proper level of ADAT2/ADAT3 catalytic activity is essential for radial migration of projection neurons in the developing mouse cortex. We demonstrated that the identified ADAT3 variants significantly impaired the abundance and, for some, the activity of the complex, leading to a substantial decrease in inosine 34 levels with direct consequence on tRNAs steady state. We correlated the severity of the migration phenotype with the degree of loss of function caused by the variants. Altogether, our results highlight the critical role of ADAT2/ADAT3 during cortical development and provide cellular and molecular insights into the pathogenic mechanisms underlying ADAT3-related neurodevelopmental disorders.

Keywords: ADAT3; deamination; neurodevelopmental disorders; neuronal migration; tRNA.


Conflict of interest statement

A.R. and G.O. are employed by the Company Arcensus GmbH. D.D.N. is listed as an inventor on a patent application filed by the Max Planck Society pertaining to the mim-tRNAseq technology.

Figures

Figure 1
Figure 1
ADAT2/ADAT3 expression pattern in the mouse embryonic cerebral cortex. (A) Quantitative reverse transcription PCR and (B) western blot analysis performed on wild-type mouse cortices showing expression of Adat3 and Adat2 transcripts (A) and proteins (B) levels throughout development from embyronic stage (E) 12.5 to postnatal stage (P) 2 (n = 3–5 cortices per stage). Data are presented as means ± standard error of the mean and normalized to E12.5. Significance was calculated by one-way ANOVA (Bonferroni's multiple comparisons test), ns = non-significant; *P < 0.05; **P < 0.01. (C and D) E18.5 (C) and E16.5 (D) mouse forebrain coronal sections immunolabelled for (C) ADAT3 and (D) ADAT2 and counterstained with DAPI (4′,6-diamidino-2-phenylindole) revealing expression of ADAT3 and ADAT2. Close-up views of the white boxed area in CP and VZ/SVZ show localization of ADAT3 and ADAT2 in both progenitors and neurons. CP = cortical plate; SVZ = subventricular zone; VZ = ventricular zone. Scale bars = 100 μm and 50 μm (C) or 20 μm (D) for magnifications. (E) Cortical neurons immunostained for ADAT3, ADAT2, TBR2, α-TUBULIN (α-TUB) and β-III-TUBULIN (β-III-TUB) and counterstained with DAPI at 0 or 2 days in vitro (DIV). Arrows point to neurons (cells positive for β-III-TUBULIN). Arrowheads point to intermediate progenitors (cells positive for TBR2). Scale bars = 25 μm.
Figure 2
Figure 2
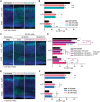
The role of ADAT3 in migrating neurons depends on its function within the ADAT2/ADAT3 complexes. (A) Coronal sections of embryonic Day (E) 18.5 mouse cortices electroporated at E14.5 with NeuroD (ND) scramble or two distinct ND-Adat3 microRNAs (miR1 and miR2) together with ND-GFP. (B) Percentage [means ± standard error of the mean (SEM)] of the positive electroporated cells (GFP+) in upper cortical plate (Up CP) and lower cortical plate (Lo CP), intermediate (IZ) and subventricular zones (SVZ) showing the faulty migration of Adat3-silenced neurons. (C) Coronal sections of E18.5 mouse cortices electroporated at E14.5 with ND scramble or ND-Adat3 miR1 together with empty vector or DCX WT ADAT3 [miR1-insensitive (ins)] and WT or catalytically inactive (CI) ND-ADAT2. (D) Percentage (means ± SEM) of the positive electroporated cells in upper (Up CP) and lower (Lo CP) cortical plate, intermediate (IZ) and subventricular zones (SVZ) showing the need of catalytic-active ADAT2 for ADAT3 to rescue the faulty migration of Adat3-silenced neurons. (E) Coronal sections of E18.5 mouse cortices electroporated at E14.5 with ND scramble or two distinct ND-Adat2 miRNAs (miR1 and miR2), together with ND-GFP. (F) Percentage (means ± SEM) of the positive electroporated cells (GFP+) in Up CP and Lo CP, IZ and SVZ showing the faulty migration of Adat2-silenced neurons. Panels B and F are related; the experiments were performed concurrently using the same ND scramble control group. (A, C and E) GFP-positive electroporated cells are depicted in green. Nuclei are stained with DAPI (4′,6-diamidino-2-phenylindole). Scale bars = 100 μm. (B, D and F) Data were analysed by two-way ANOVA with Bonferroni's multiple comparisons test. Number of embryos analysed: (B) NeuroD Scramble, n = 8; NeuroD miR1-Adat3, n = 9; NeuroD miR2-Adat3, n = 10; (D) NeuroD Scramble, n = 19; Empty + NeuroD Adat2 + NeuroD miR1-Adat3, n = 12; NeuroD Adat2 + DCX Adat3 + NeuroD miR1-Adat3, n = 15; NeuroD Adat2 C.I + DCX Adat3 + NeuroD miR1-Adat3, n = 3; (F) NeuroD Scramble and NeuroD miR1-Adat2, n = 8; NeuroD miR2-Adat2, n = 9; ns = non-significant; *P < 0.05; **P < 0.01; ***P < 0.001; ****P < 0.0001.
Figure 3
Figure 3
Clinical features of patients with ADAT3 variants. (AF) Axial and/or sagittal T1- and T2-weighted brain MRI images of (A) Patient 1, (B) Patient 2, (C) Patients 5 and 6, (D) Patient 9, (E) Patient 16, (F) Patient 19 and (G) Patient 21. The red arrows point to thin corpus callosum, red arrowhead indicates the simplified gyral pattern of the cortex. Asterisks show enlarged ventricles. White arrow and arrowhead indicate, respectively, adenoid hypertrophy and cavum septum pellucidum. (H) Schematic representation of human ADAT3 protein indicating positions of all variants identified so far. Variants depicted in the same colour were found in the same patient. In vivo functional tests have been performed for the variants that are underlined. (I) Western blot analysis of p.V144M/p.V144M and p.A196V/p.A196L (Patients 10 and 11) patient cells revealing reduced ADAT3 protein levels in comparison to controls [controls, n = 9; V144M/V144M, n = 3 and A196V/A196L, n = 6 (three of each patient)]. α-Tubulin (α-TUB) is used as a protein loading control. Both commercial (com) and homemade (HM) antibodies have been used to detect ADAT3 proteins. Red dashed line indicates where the membrane was cut. One-way ANOVA, Bonferroni's multiple comparisons test. ***P < 0.001; ****P < 0.0001. LCL = lymphoblastoid cell lines.
Figure 4
Figure 4
The V128M and A180V/L ADAT3 mutants affect ADAT2/ADAT3 stability, structure and deamination activity. (A) Ribbon representation of the crystallographic structure of the wild-type (WT) mouse ADAT complex (PDB entry 7nz8). The catalytic domain of ADAT is composed of ADAT2 (magenta) and the C-terminal domain of ADAT3 (blue; ADAT3C). The N-terminal domain of ADAT3 (cyan; ADAT3N) is key to recognizing tRNAs through its ferredoxin-like domain (FLD) and to rotate with respect to the ADAT catalytic domain to position the tRNA anticodon loop within the ADAT2 active site. The two residues (V128 and A180), shown in red and that are found mutated in patients, are displayed. These are located in different regions of the ADAT complex. (B) SDS-PAGE (sodium dodecyl-sulfate polyacrylamide gel electrophoresis) analysis of expression levels in E. coli of untagged ADAT2 WT and His-tagged ADAT3 (WT and A180V, A180L, V128M mutants) constructs, either alone or in combination. Expression levels are similar for all constructs used. (C) SDS-PAGE analysis of His-tag affinity-purified samples of B. In the absence of ADAT2, the ADAT3 mutant constructs show a significant decrease in solubility compared with WT. Co-expression of ADAT2 with these constructs restore solubility upon formation of the ADAT2/ADAT3 complex albeit to different extents. (D) Close-up view and comparative structural analysis of the region of the ADAT complex harbouring A180 in the ADAT2/ADAT3 and ADAT2/ADAT3-A180V complex structures. The A180V mutation induces local changes in the main chain neighbouring secondary structure elements, including in the central β-sheet organizing the ADAT3 C-terminal domain. (E) Deamination assays for mouse ADAT3 WT, A180V, A180L and V128M in complex with ADAT2. Whereas the WT and A180V complexes have similar activities, the A180L and V128M complexes show a similar decrease in activity. Data (means ± standard error of the mean) from three different experiments per condition were analysed by two-way ANOVA, with Dunnett's multiple comparison test. ns = non-significant; ****P < 0.0001.
Figure 5
Figure 5
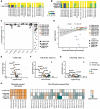
Deamination and abundance of ADAT2/ADAT3 target tRNAs are decreased in patient cells. (A and B) Heat map showing I34 levels in ADAT target tRNA isodecoders in LCLs (lymphoblastoid cell lines) derived from (A) p.V144M/ p.V144M and (B) p.A196V/p.A196L patients compared with controls. [Controls, n = 2; V144M/V144M, n = 2; A196V/A196L (Patient 10) n = 3; A196V/A196L (Patient 11) n = 3]. (C) Graph showing the percentage change in ADAT target tRNAs of all other seven modifications (m1G9, acp3U20, m22G26, m3C32, m1I37, yW37, m1A58) that can be detected by mim-tRNA seq. The change in I34 levels is depicted as a side view for comparison. tRNA isoacceptors from comparison of control LCLs to LCLs derived from V144M/V144M, A196V/A196L (Patient 10) and A196V/A196L (Patient 11) are depicted with squares, circles and triangles, respectively. Isoacceptors are coloured as indicated. (D) Graph showing the correlation between the change in I34 proportion and the change in mature tRNA levels in log2 scales. Black dashed line is the trend line and standard deviation is shown with a grey zone. tRNA isodecoders from comparison of control LCLs to LCLs derived from V144M/V144M, A196V/A196L (Patient 10) and A196V/A196L (Patient 11) are depicted with squares, circles and triangles, respectively. Isodecoders are coloured as indicated. (EG) Volcano plot showing the negative log10 adjusted P-value (P-adj) of all tRNAs pooled at the anticodon level against their log2 fold change (log2FC) in LCLs derived from (E) p.V144M/p.V144M (n = 2), (F) p.A196V/p.A196L (Patient 10, n = 3) and (G) p.A196V/p.A196L (Patient 11, n = 3) compared with controls (controls, n = 2). Triangles and circles show ADAT targets and non-target tRNAs, respectively. Green, orange and grey represent upregulated, downregulated and unchanged tRNAs, respectively, based on DESeq2 P-adj < 0.05. (H) Heat map showing log2 DESeq2 fold change of differentially regulated ADAT target tRNAs and non-target tRNAs summed by anticodon. White boxes show non-significant ones.
Figure 6
Figure 6
Missense variants in Adat3 impair neuronal migration. (A) Coronal sections of embryonic Day (E)18.5 mouse cortices electroporated at E14.5 with NeuroD (ND) ADAT2 and ND-GFP together with either ND scramble or ND Adat3 miRNAs in combination with DCX Empty; DCX ADAT3 [miR1-insensitive (ins)] at two different concentrations (0.5 or 0.75 µg/µl) or various variants (at 0.75 µg/µl). GFP-positive electroporated cells are depicted in green. Nuclei are stained with DAPI (4′,6-diamidino-2-phenilindole). Scale bar = 100 μm. (B and C) Analysis of percentage (means ± standard error of the mean) of electroporated cells in upper (Up CP) and lower (Lo CP) cortical plate, intermediate (IZ) and subventricular zone (SVZ) showing a dose-dependent rescue of migration with wild-type proteins and absence of rescue with most of the variants. Data were analysed by two-way ANOVA (Tukey's multiple comparison test). Number of embryos analysed: NeuroD Scramble, n = 13; NeuroD miR1-Adat3 + Empty, n = 12; NeuroD miR1-Adat3 + DCX WT (0.5 μg/μl), n = 4; NeuroD miR1-Adat3 + DCX WT (0.75 μg/μl), n = 15; NeuroD miR1-Adat3 + DCX V128M, n = 5; NeuroD miR1-Adat3 + DCX A180L, n = 13; NeuroD miR1-Adat3 + DCX A180V, n = 6; ns = non-significant; *P < 0.05; **P < 0.01; ***P < 0.001; ****P < 0.0001.

Update of

References

    1. Cantara WA, Crain PF, Rozenski J, et al. The RNA modification database, RNAMDB: 2011 update. Nucleic Acids Res. 2011;39:D195–D201. - PMC - PubMed
    1. Cappannini A, Ray A, Purta E, et al. MODOMICS: A database of RNA modifications and related information. 2023 update. Nucleic Acids Res. 2024;52:D239–D244. - PMC - PubMed
    1. de Crecy-Lagard V, Boccaletto P, Mangleburg CG, et al. Matching tRNA modifications in humans to their known and predicted enzymes. Nucleic Acids Res. 2019;47:2143–2159. - PMC - PubMed
    1. Phizicky EM, Alfonzo JD. Do all modifications benefit all tRNAs? FEBS Lett. 2010;584:265–271. - PMC - PubMed
    1. Agris PF, Vendeix FA, Graham WD. tRNA’s wobble decoding of the genome: 40 years of modification. J Mol Biol. 2007;366:1–13. - PubMed

MeSH terms