. 2025 Jun 20;6(2):103706.
doi: 10.1016/j.xpro.2025.103706. Epub 2025 Mar 20.

Protocol for the generation and assessment of functional macrophages from mouse bone marrow cells

Affiliations

Protocol for the generation and assessment of functional macrophages from mouse bone marrow cells

Andrea Scafidi et al. STAR Protoc. .

Abstract

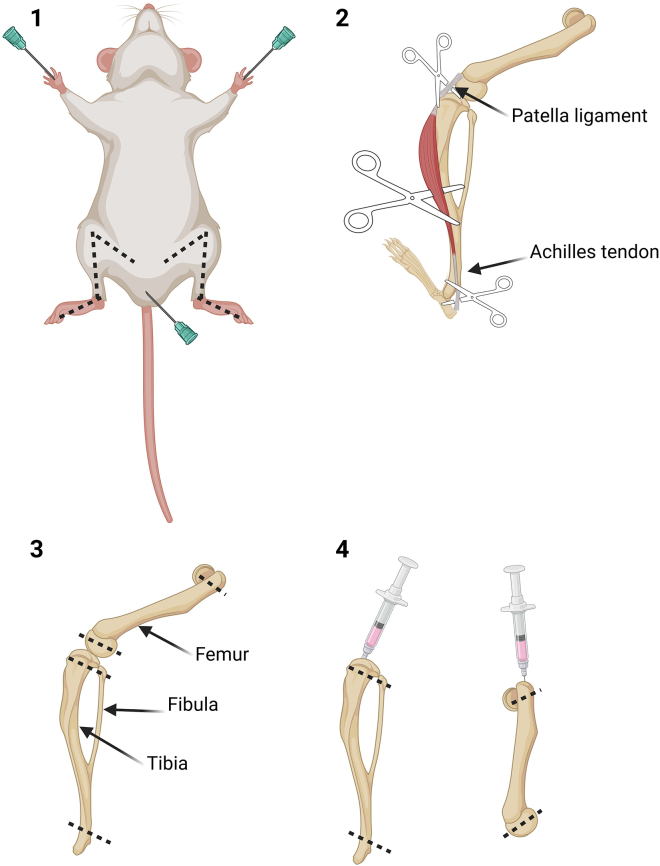
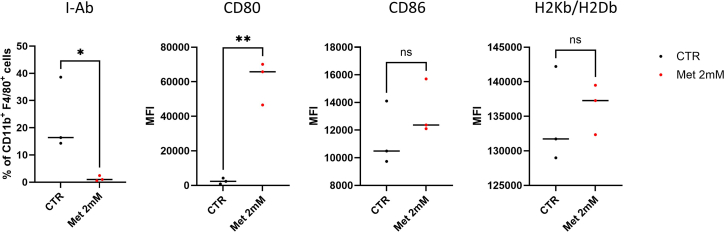
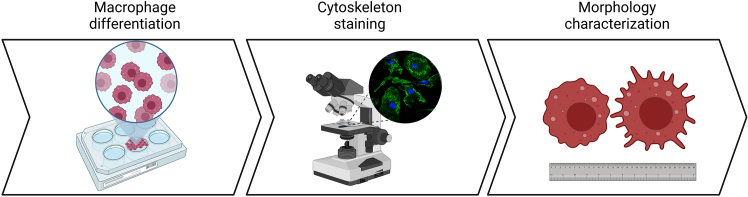
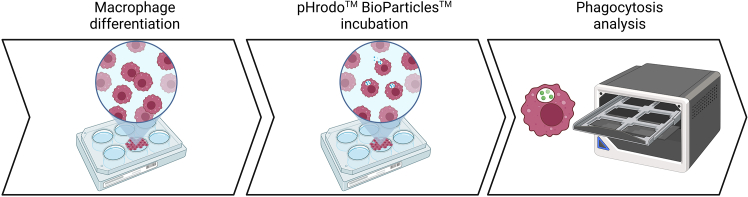
Macrophages play essential roles in tissues, wherein they exert beneficial or detrimental functions depending on the signals they encounter during their differentiation. Here, we present a protocol to differentiate mouse bone marrow cells into macrophages under specific cues to evaluate their impact on macrophage phenotypic acquisition. We provide detailed instructions for optimal cell culture conditions, quality controls, and examples of concluding immunological functional assays. This protocol is applicable in short- and long-term drug-based modulation of macrophage functions. For complete details on the use and execution of this protocol, please refer to Scafidi et al.1.

Keywords: Cell biology; Cell culture; Cell isolation; Immunology; Model organisms; Molecular biology.


Conflict of interest statement

Declaration of interests The authors declare no competing interests.

Figures

None
Graphical abstract
Figure 1
Figure 1
Schematic representation of the protocol used to differentiate mouse bone marrow cells into macrophages
Figure 2
Figure 2
Schematic representation of mouse leg dissection and bone marrow cell extraction
Figure 3
Figure 3
Gating strategy used for the identification of fully differentiated BMDMs The same gating strategy was applied for untreated (CTR) and metformin-treated (Met 2 mM) conditions.
Figure 4
Figure 4
Assessment of specific macrophage markers in metformin-treated and untreated BMDMs Quantification of percentage of I-Ab+ cells and expression levels of CD80, CD86, and H2Kb/H2Db shown as mean fluorescence intensity (MFI) in CD11b+ F4/80+ untreated (CTR) and metformin-treated (Met 2 mM) cells. Unpaired t-test, n = 3 biological replicates, ns = p-val>0.05, ∗ = p-val<0.05, ∗∗ = p-val<0.01.
Figure 5
Figure 5
Schematic representation of BMDM cytoskeleton analysis
Figure 6
Figure 6
Assessment of cytoskeleton modifications in untreated and metformin-treated BMDMs (A) Untreated (CTR) and metformin-treated (Met 2 mM) BMDMs stained with phalloidin (green) and DAPI (blue). Scale bar: 100 μm. (B) Quantification of eccentricity and major axis length of untreated and 2 mM metformin-treated BMDMs. Dashed lines represent the median while the dotted lines represent the quartiles. Two-tailed Mann-Whitney U test, n = 3 biological replicates, more than 300 cells per image in each condition. ∗∗∗∗ = p-val<0.0001.
Figure 7
Figure 7
Schematic representation of BMDM co-culture with tumor cells and cytotoxicity analysis
Figure 8
Figure 8
Gating strategy used for the identification of target cells that underwent cytolysis Graphs in the first row show the gates applied to remove debris and doublets in both control (CTR) and metformin-treated (Met 2 mM) BMDMs. Graphs in the second and third raw represent the gating strategy applied for the quantification of target dead cells at different ratios (1/2 left, 1/1 center, 1/1 right) after co-culture with control (CTR) and metformin-treated (Met 2 mM) BMDMs.
Figure 9
Figure 9
Assessment of BMDM cytotoxicity towards tumor cells Quantification of percentage of dead glioma GL261 cells, normalized on their spontaneous death, after incubation with untreated or 2 mM metformin-treated BMDMs at different E/T ratios. Paired t-test, n = 3 biological replicates, ns = p-val>0.05, ∗ = p-val<0.05.
Figure 10
Figure 10
Schematic representation showing the experimental settings used to assess the phagocytic capacity of BMDMs
Figure 11
Figure 11
Assessment of BMDM phagocytic capacity (A) Representative IncuCyte images for quantification of engulfed particles. Upper pictures represent the initial state, before incubation with pHrodo bioparticles of untreated (CTR) and 2 mM metformin-treated (Met 2 mM) BMDMs. Lower pictures show untreated (CTR) and 2 mM metformin-treated (Met 2 mM) BMDMs after 25 h incubation with pHrodo bioparticles. Scale bar: 200 μm. Red color represents fluorescence emitted by engulfed pHrodo bioparticles. (B) Quantification of normalized phagocytic index using the IncuCyte analysis software. Graph shows phagocytic index ± SD. 2-way ANOVA, n = 3 biological replicates, ∗∗∗ = p-val<0.001.

References

    1. Scafidi A., Lind-Holm Mogensen F., Campus E., Pailas A., Neumann K., Legrave N., Bernardin F., Pereira S.L., Antony P.M.A., Nicot N., et al. Metformin impacts the differentiation of mouse bone marrow cells into macrophages affecting tumour immunity. Heliyon. 2024;10 doi: 10.1016/j.heliyon.2024.e37792. - DOI - PMC - PubMed
    1. Dash S.P., Gupta S., Sarangi P.P. Monocytes and macrophages: Origin, homing, differentiation, and functionality during inflammation. Heliyon. 2024;10 doi: 10.1016/j.heliyon.2024.e29686. - DOI - PMC - PubMed
    1. Imhof B.A., Aurrand-Lions M. Adhesion mechanisms regulating the migration of monocytes. Nat. Rev. Immunol. 2004;4:432–444. doi: 10.1038/nri1375. - DOI - PubMed
    1. Stirling D.R., Swain-Bowden M.J., Lucas A.M., Carpenter A.E., Cimini B.A., Goodman A. CellProfiler 4: improvements in speed, utility and usability. BMC Bioinf. 2021;22:433. doi: 10.1186/s12859-021-04344-9. - DOI - PMC - PubMed

LinkOut - more resources