

Sampling method influences Salmonella detection and quantification in pre-harvest commercial broiler production
- PMID: 40120251
- PMCID: PMC11987617
- DOI: 10.1016/j.psj.2025.104963
Sampling method influences Salmonella detection and quantification in pre-harvest commercial broiler production
Abstract
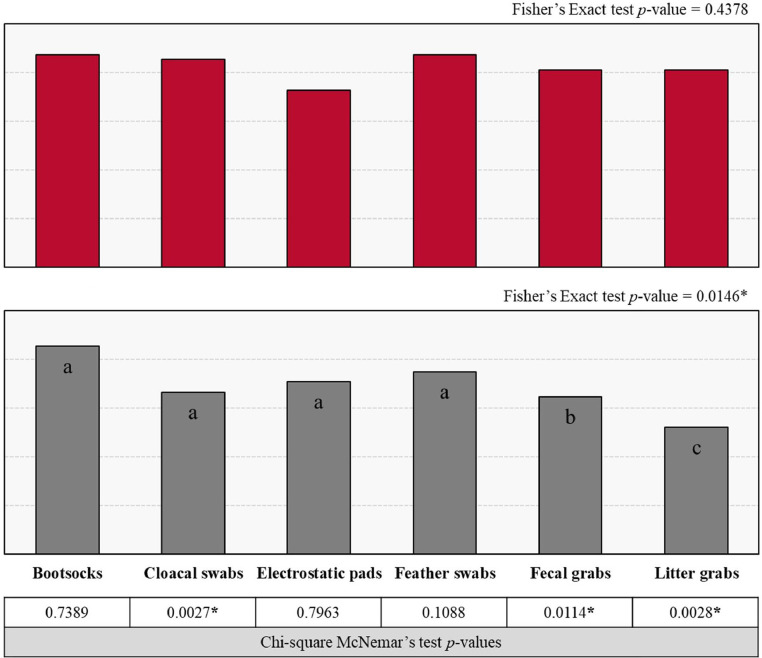
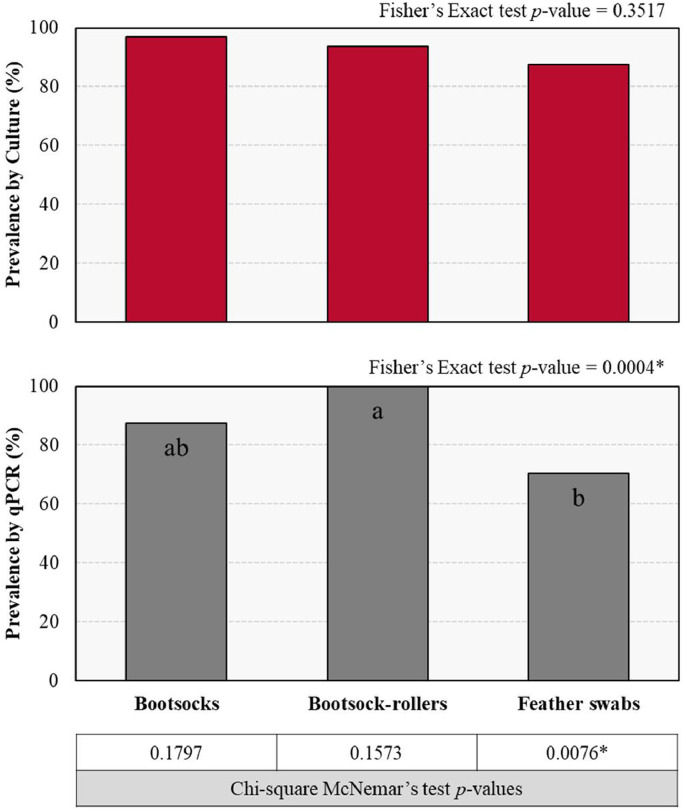
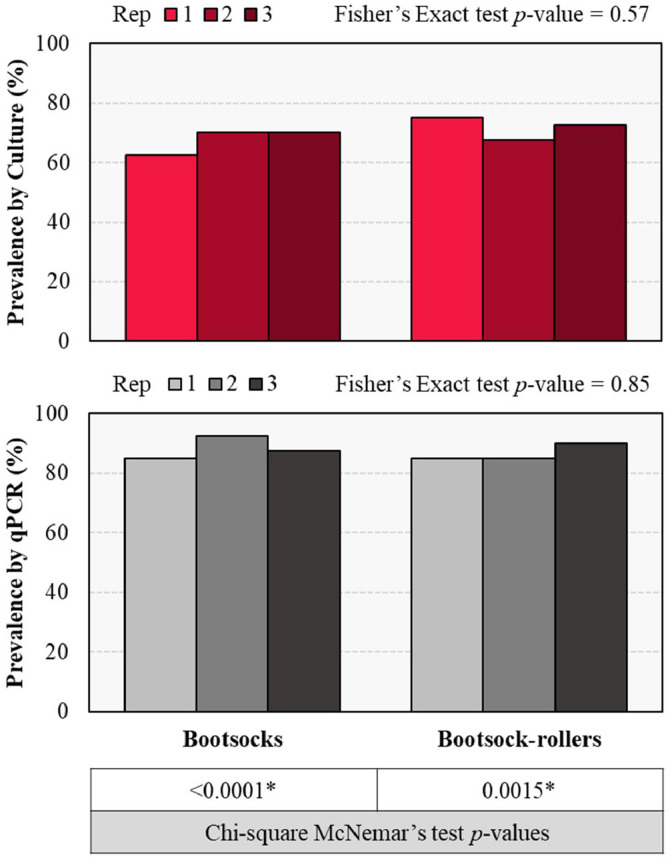
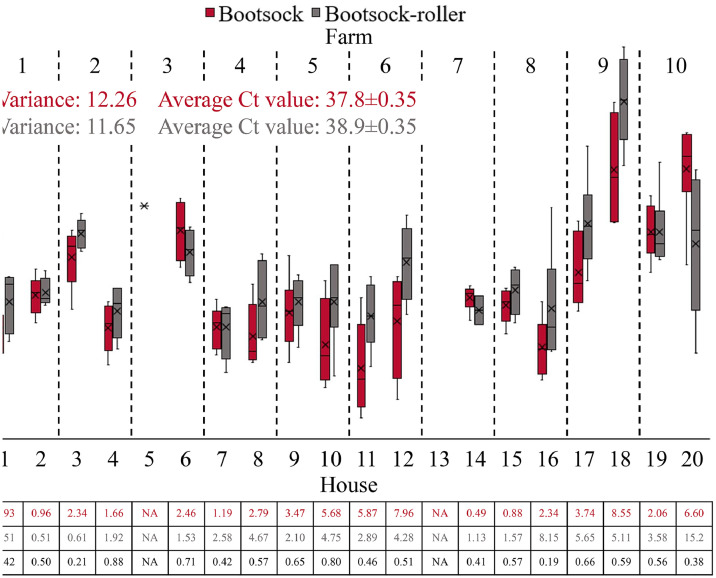
Effective pre-harvest Salmonella monitoring in broilers relies on accurate, reliable, and reproducible evaluation of pre-harvest Salmonella. In this study, six sampling methods were evaluated and compared to assess Salmonella prevalence and quantification during broiler production across three iterative experiments. In experiment one, bootsocks, electrostatic pad-rollers, feather swabs, cloacal swabs, fecal grabs, and litter grabs were collected from 24 houses across 10 farms (n = 288 samples). In the second experiment, bootsocks, bootsock-rollers, and feather swabs were collected in 16 houses on seven farms (n = 128). Bootsocks and bootsock-rollers were selected as the most reproducible sampling method. In experiment three both methods were performed in triplicate in 20 houses on 10 farms (n = 240). In all experiments, prevalence was determined by qPCR and by culture, then compared by Fisher's Exact test between and McNemar's test within methods. Salmonella was quantified by qPCR and Ct-values were compared using one-sided F-test. In experiment one, prevalence differed between methods by qPCR (p = 0.0150) only and the best performing sampling methods were bootsocks (42/48 culture and 41/48 qPCR positive), feather swabs (42/48 and 36/48), and electrostatic pad-rollers (35/48 and 34/48). In experiment 2, feather swabs differed by qPCR prevalence (p = 0.0004). Bootsocks (30/32 culture and 28/32 qPCR positive) and bootsock-rollers (31/32 and 32/32) performed best. In experiment 3, qPCR prevalence (210/240) was greater than culture (167/240) (p = 0.0021), but no differences were observed between methods or replicates. The average Ct-value for bootsocks and bootsock-rollers were 37.8 and 38.9, respectively and there was no difference in their variance (p = 0.8061). A linear mixed-effect model found that farm contributed 36.34 % of the variance observed while house, house-side, and replicate accounted for 24.69 %, 4.68 % and 3.85 %, respectively. This study shows that sampling methods directly influence both Salmonella detection and load recovery. For surveillance sampling, bootsocks and bootsock-rollers were found to best indicate pre-harvest Salmonella. These two methods were highly reproducible, user friendly, and provide the most reliable Salmonella results indicating the Salmonella prevalence in broiler flocks during production.
Keywords: Broiler; Pre-harvest; Salmonella; Surveillance sampling.
Copyright © 2025. Published by Elsevier Inc.
Conflict of interest statement
Declaration of competing interest The authors declare the following financial interests/personal relationships which may be considered as potential competing interests: Nikki Shariat reports financial support was provided by US Poultry and Egg Association. Emily Cason reports financial support was provided by Foundation for Food and Agriculture Research. If there are other authors, they declare that they have no known competing financial interests or personal relationships that could have appeared to influence the work reported in this paper.
Figures
Similar articles
-
Salmonella spp. contamination in commercial layer hen farms using different types of samples and detection methods.Poult Sci. 2017 Aug 1;96(8):2820-2830. doi: 10.3382/ps/pex053. Poult Sci. 2017. PMID: 28379493
-
Lighting during grow-out and Salmonella in broiler flocks.Acta Vet Scand. 2010 Jun 29;52(1):46. doi: 10.1186/1751-0147-52-46. Acta Vet Scand. 2010. PMID: 20587037 Free PMC article.
-
Longitudinal study reveals persistent environmental Salmonella Heidelberg in Brazilian broiler farms.Vet Microbiol. 2019 Jun;233:118-123. doi: 10.1016/j.vetmic.2019.04.004. Epub 2019 Apr 6. Vet Microbiol. 2019. PMID: 31176397
-
Prevalence and concentration of Salmonella and Campylobacter in the processing environment of small-scale pastured broiler farms.Poult Sci. 2013 Nov;92(11):3060-6. doi: 10.3382/ps.2013-03114. Poult Sci. 2013. PMID: 24135612
-
Sampling and bacteriological detection of Salmonella in poultry and poultry premises: a review.Rev Sci Tech. 2008 Dec;27(3):665-77. doi: 10.20506/rst.27.3.1829. Rev Sci Tech. 2008. PMID: 19284036 Review.
References
-
- Arsenault J., Letellier A., Quessy S., Morin J.-P., Boulianne M. Prevalence and risk factors for Salmonella and Campylobacter spp. Carcass contamination in turkeys slaughtered in Quebec, Canada. J. Food Prot. 2007;70(6):1350–1359. - PubMed
-
- Bailey J.S., Stern N.J., Fedorka-Cray P., Craven S.E., Cox N.A., Cosby D.E., Ladely S., Musgrove M.T. Sources and movement of Salmonella through integrated poultry operations: a multistate epidemiological investigation. J. Food Prot. 2001;64(11):1690–1697. doi: 10.4315/0362-028X-64.11.1690. - DOI - PubMed
-
- Berghaus R.D., Thayer S.G., Law B.F., Mild R.M., Hofacre C.L., Singer R.S. Enumeration of Salmonella and Campylobacter spp. In environmental farm samples and processing plant carcass rinses from commercial broiler chicken flocks. Appl. Environ. Microbiol. 2013;79(13):4106–4114. doi: 10.1128/AEM.00836-13. - DOI - PMC - PubMed
MeSH terms
LinkOut - more resources
Full Text Sources
