. 2025 Apr 15;6(4):102033.
doi: 10.1016/j.xcrm.2025.102033. Epub 2025 Mar 21.

A combined "eat me/don't eat me" strategy based on exosome for acute liver injury treatment

Affiliations

A combined "eat me/don't eat me" strategy based on exosome for acute liver injury treatment

Wei Du et al. Cell Rep Med. .

Abstract

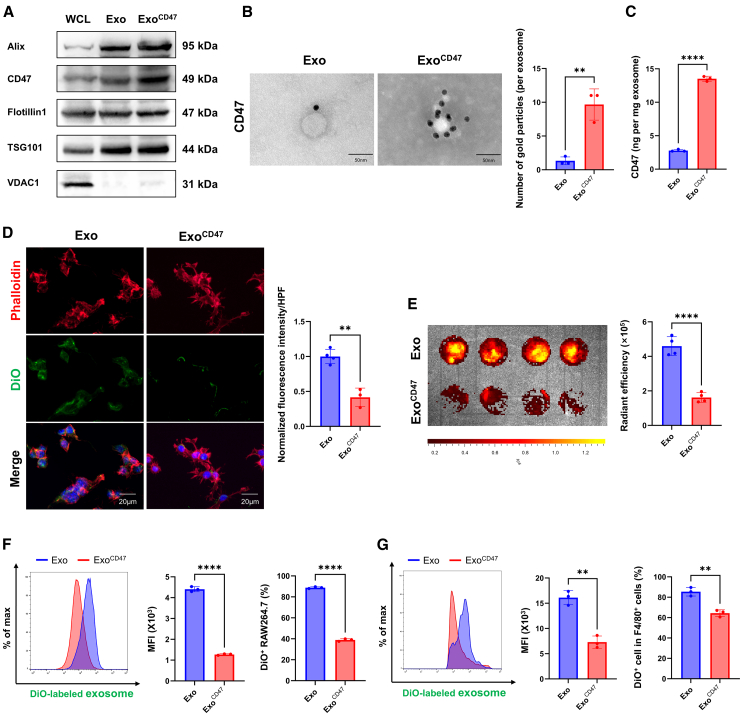
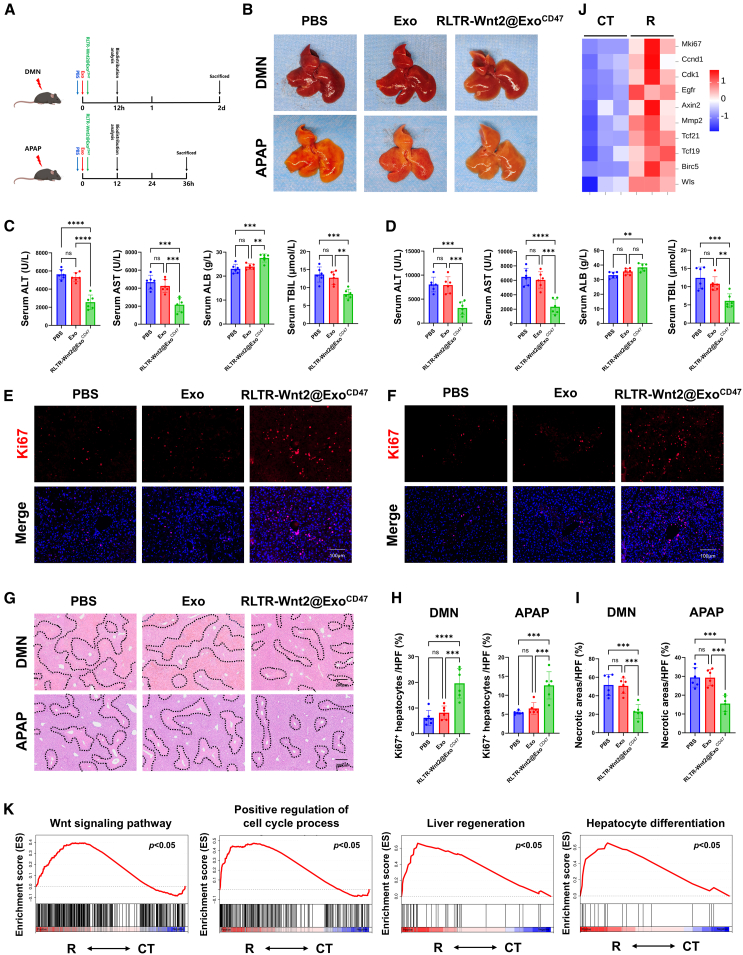
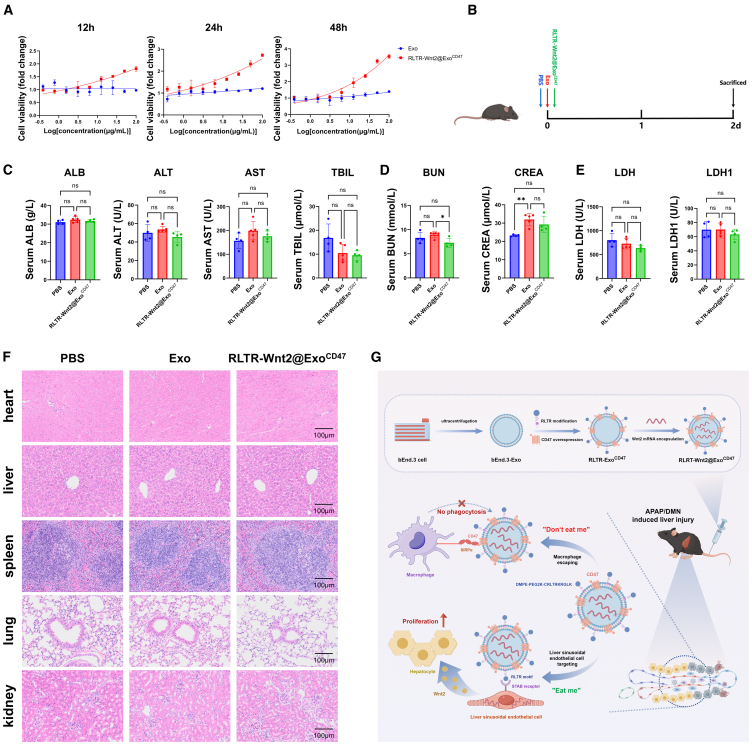
Drug-induced liver injury (DILI) involves multifaceted pathogenesis, necessitating effective therapeutic strategies. Wnt2, secreted by liver sinusoidal endothelial cell (LSEC), activates the Wnt/β-catenin signaling pathway to promote hepatocyte proliferation after injury. To address the dual challenges of targeted delivery and phagocytosis evasion, we develop a combined "eat me/don't eat me" strategy. RLTRKRGLK (RLTR) peptide-functionalized exosomes are engineered by inserting DMPE-PEG2000-CRLTRKRGLK into the lipid membrane of exosome derived from bEnd.3 cell. Surface-displayed RLTR mediates exosomal enrichment in LSEC, while CD47 engineering reduces macrophage clearance via "don't eat me" signaling. Then, lentiviral transfection enables stable encapsulation of functional Wnt2 mRNA into ExoCD47 (designated Wnt2@ExoCD47). In both acetaminophen (APAP) and dimethylnitrosamine (DMN)-induced murine liver injury models, RLTR-Wnt2@ExoCD47 demonstrates LSEC-specific targeting and significant hepatoprotection. This engineered exosome platform provides a therapeutic strategy for DILI.

Keywords: Wnt/β-catenin pathway; drug-induced liver injury; engineered exosome; liver regeneration; liver sinusoidal endothelial cell.


Conflict of interest statement

Declaration of interests The authors declare no competing interests.

Figures

None
Graphical abstract
Figure 1
Figure 1
Synthesis and characterization of RLTR-Exo (A and B) TEM image and NTA for size of exosomes isolated from bEnd.3. Scale bar: 200 nm. (C) Western blotting (WB) for Alix, Flotillin1, VDAC1, and TSG101. (D) Chemical structural formula of DMPE-PEG2000-CRLTRKRGLK. (E) 1H NMR spectrum of DMPE-PEG2000-CRLTRKRGLK and CRLTRKRGLK. (F) Schematic illustration of the procedure to produce engineered exosome (RLTR-Exo). (G) TEM images of Exo and RLTR-Exo. (H) Particle size distributions of Exo and RLTR-Exo measured by NanoFCM. (I) Modification efficiency of RLTR-Exo detected via NanoFCM.
Figure 2
Figure 2
RLTR peptide surface modification enhances exosome uptake by LSEC in vitro and in vivo (A) CLSM images showing internalization of Exo and RLTR-Exo by primary LSEC in vitro and quantitative analysis of the DiO fluorescence intensity. Red: TRITC-phalloidin labeled F-actin. Green: DiO-labeled Exo and RLTR-Exo. Blue: DAPI labeled nuclei. Exo: n = 4, RLTR-Exo: n = 3. Scale bar: 20 μm. (B) Ex vivo fluorescence images showing the retention of DiI-labeled Exo (up) and RLTR-Exo (down) in primary LSEC 0.5 h after incubation and quantitative analysis of the radiant efficiency of ex vivo images. (C) Ex vivo fluorescence images of main organs treated with DiI-labeled Exo or DiI-labeled RLTR-Exo on day 0.5, 3, 5, 7, 10, and 14 after administration (n = 3 for all groups). (D) Quantification of fluorescence intensity over the 14-day treatment period. Data are normalized to the fluorescence intensity at 12 h. (E) Representative histograms indicating mean fluorescence intensity (MFI) of DiO-labeled Exo and RLTR-Exo in LSEC. Quantitative data of the MFI of DiO-labeled Exo and RLTR-Exo in LSEC. FCM analysis of FITC+ LSEC ratio after intravenous administration of DiO-labeled Exo and RLTR-Exo. Exo: n = 4, RLTR-Exo: n = 5. (F) Schematic diagram of single and sequential strategies. (G) Immunofluorescence of liver frozen sections collected from mice with different injection strategies showing the cellular uptake and internalization of exosomes by LSEC. Quantitative data of the internalized DiO-labeled exosomes by LSECs with different injection strategies. Red: LYVE1. Green: DiO-labeled Exo and RLTR-Exo. Blue: DAPI-labeled nuclei. Exo: n = 5, RLTR-Exo: n = 6, Exo + Exo: n = 3, Exo + RLTR-Exo: n = 3. Scale bar: 50 μm. Data are represented as mean ± SD (error bars) from biological replicates. Statistical analyses, n.s., not significant, ∗p < 0.05, ∗∗p < 0.01, ∗∗∗p < 0.001, ∗∗∗∗p < 0.0001. Statistical significance was determined by unpaired Student’s t test or one-way ANOVA where appropriate. See also Figure S1.
Figure 3
Figure 3
CD47 engineering exosome escapes the phagocytosis by macrophages (A) WB analysis for Alix, Flotillin1, TSG101, VDAC1, and CD47 of bEnd.3 whole-cell lysate (WCL), Exo, and ExoCD47. (B) TEM imaging and gold particles quantification of immune-gold-labeled Exo and ExoCD47. Gold particles are depicted as black dots. n = 3. Scale bar, 50 nm. (C) ELISA of CD47 on the surface of Exo and ExoCD47. n = 3. (D) CLSM images of internalization of Exo and ExoCD47 by RAW264.7. Red: TRITC-phalloidin-labeled F-actin. Green: DiO-labeled Exo and RLTR-Exo. Blue: DAPI-labeled nuclei. Exo: n = 4, ExoCD47: n = 3. Scale bar: 20 μm. (E) Ex vivo fluorescence image showing the retention of DiI-labeled Exo (up) and ExoCD47 (down) in RAW264.7 at 1 h after incubation. n = 4. (F) Representative histograms indicating mean fluorescence intensity (MFI) of DiO-labeled Exo and ExoCD47 in RAW264.7. Quantitative data of the MFI of DiO-labeled Exo and ExoCD47 in RAW264.7. FCM analysis of FITC+ RAW264.7 ratio after incubation with DiO-labeled Exo and ExoCD47. n = 3. (G) Representative histograms indicating mean fluorescence intensity (MFI) of DiO-labeled Exo and ExoCD47 in KCs. FCM analysis of FITC+ KC ratio after intravenous administration of DiO-labeled Exo and ExoCD47. n = 3. Data are represented as mean ± SD (error bars) from biological replicates. Statistical analyses, n.s., not significant, ∗∗p < 0.01, ∗∗∗∗p < 0.0001. Statistical significance was determined by unpaired Student’s t test. See also Figure S2.
Figure 4
Figure 4
Efficacy of Wnt2 mRNA-loaded exosome in vitro (A) Wnt2 mRNA expression in Exo and Wnt2@ExoCD47 detected by RT-qPCR. n = 3. (B) CLSM images showing the internalization of DiO-labeled Exo and Wnt2@ExoCD47 by HUVEC (left), 293T (meddle), and primary LSEC (right). Red: TRITC-phalloidin-labeled F-actin. Green: DiO-labeled Exo and Wnt2@ExoCD47. Blue: DAPI-labeled nuclei. Scale bar: 20 μm (C) ELISA analysis of Wnt2 concentration in culture supernatant of HUVEC (left), 293T (meddle), and primary LSEC (right) at 48 h after incubation with Exo and Wnt2@ExoCD47. n = 3. (D) RT-qPCR shows higher Wnt2 mRNA transcript levels after in vitro delivery of Wnt2 mRNA from Wnt2@ExoCD47 (Exo vs. Wnt2@ExoCD47) in 48 h. n = 3. (E) Following incubation with conditioned medium for 24 h, RT-qPCR was employed to analyze the changes in downstream target genes of the Wnt pathway in the primary hepatocytes. n = 3. Data are represented as mean ± SD (error bars) from biological replicates. Statistical analyses, n.s., not significant, ∗p < 0.05, ∗∗p < 0.01, ∗∗∗p < 0.001, ∗∗∗∗p < 0.0001. Statistical significance was determined by unpaired Student’s t test.
Figure 5
Figure 5
The engineered exosome treatment alleviates DMN/APAP-induced acute liver injury (A) Schematic illustration of the experimental procedure. (B) The overall appearance of the livers in DMN (up)- and APAP (down)-induced acute liver injury mice after tail vein administration of PBS, Exo, or RLTR-Wnt2@ExoCD47. (C) Serum ALT, AST, ALB, and TBIL of mice with DMN-induced liver injury at 48 h after PBS, Exo, or RLTR-Wnt2@ExoCD47 administration. n = 6. ALB, albumin; ALT, alanine aminotransferase; AST, aspartate aminotransferase; TBIL, total bilirubin. (D) Serum ALT, AST, ALB, and TBIL of mice with APAP-induced liver injury at 48 h after PBS, Exo, or RLTR-Wnt2@ExoCD47 administration. n = 6. ALB, albumin; ALT, alanine aminotransferase; AST, aspartate aminotransferase; TBIL, total bilirubin. (E and F) Ki67 immunofluorescence staining of DMN (E)- and APAP (F)-injured liver after PBS, Exo, or RLTR-Wnt2@ExoCD47 administration. Red: ki67. Blue: nuclei. Scale bar: 100 μm. (G) H&E staining of liver collected from DMN (up) and APAP (down) mice after treated with PBS, Exo, or RLTR-Wnt2@ExoCD47. Scale bar: 200 μm. (H) Quantitative analysis of the Ki67+ hepatocytes ratio. n = 6. (I) Quantitative analysis of the necrotic areas. n = 6. (J) The heatmap based on the differently expressed genes between livers from control and RLTR-Wnt2@ExoCD47 group. Data were obtained from biological replicates. CT: control group, R: RLTR-Wnt2@ExoCD47 group. (K) GSEA revealing the enrichment of differently expressed genes in the Wnt, positive regulation of cell-cycle process, liver regeneration, and hepatocyte differentiation signaling pathways. n = 3. CT, control group; R, RLTR-Wnt2@ExoCD47 group. Data are represented as mean ± SD (error bars) from biological replicates. Statistical analyses, n.s., not significant, ∗∗p < 0.01, ∗∗∗p < 0.001, ∗∗∗∗p < 0.0001. Statistical significance was determined by one-way ANOVA. See also Figures S3–S6.
Figure 6
Figure 6
Safety evaluation of the engineered exosome in vitro and in vivo (A) Cell viability of bEnd.3 was analyzed by CCK8 assay after incubation with different concentrations of Exo or RLTR-Wnt2@ExoCD47 at 12, 24, and 48 h. n = 3. (B) Scheme showing the treatment timeline of PBS, Exo, and RLTR-Wnt2@ExoCD47. (C–E) Quantitative analysis of serological detection indicators about liver function (C), renal function (D), and myocardial enzymes (E) in serum of mice with different treatment. PBS: n = 4, Exo: n = 5, RLTR-Wnt2@ExoCD47: n = 4. ALB, albumin; ALT, alanine aminotransferase; AST, aspartate aminotransferase; TBIL, total bilirubin; BUN, blood urea nitrogen; CREA, creatine; LDH, lactate dehydrogenase; LDH1, lactate dehydrogenase 1. (F) H&E-stained images of the major organs (heart, liver, spleen, lung, and kidney) collected from mice in different treatment groups after sacrifice. Scale bar: 100 μm. (G) Schematic showed the working model of this study. Exosomes are isolated from bEnd.3 culture medium and engineered with a dual-targeting “eat me/don’t eat me” strategy, enabling them to evade macrophage phagocytosis while specifically targeting LSEC. Engineered exosomes deliver Wnt2 mRNA to LSEC, enhancing the release of Wnt2 into the sinusoidal niche. This activates the Wnt/β-catenin signaling pathway in hepatocytes, driving liver regeneration following acute liver injury. Data are represented as mean ± SD (error bars) from biological replicates. Statistical analyses, n.s., not significant, ∗p < 0.05, ∗∗p < 0.01. Statistical significance was determined by one-way ANOVA.

References

    1. Andrade R.J., Chalasani N., Björnsson E.S., Suzuki A., Kullak-Ublick G.A., Watkins P.B., Devarbhavi H., Merz M., Lucena M.I., Kaplowitz N., Aithal G.P. Drug-induced liver injury. Nat. Rev. Dis. Primers. 2019;5:58. - PubMed
    1. Yan M., Huo Y., Yin S., Hu H. Mechanisms of acetaminophen-induced liver injury and its implications for therapeutic interventions. Redox Biol. 2018;17:274–283. - PMC - PubMed
    1. Tujios S.R., Lee W.M. Acute liver failure induced by idiosyncratic reaction to drugs: Challenges in diagnosis and therapy. Liver Int. 2018;38:6–14. - PMC - PubMed
    1. Gracia-Sancho J., Caparrós E., Fernández-Iglesias A., Francés R. Role of liver sinusoidal endothelial cells in liver diseases. Nat. Rev. Gastroenterol. Hepatol. 2021;18:411–431. - PubMed
    1. Zhao L., Jin Y., Donahue K., Tsui M., Fish M., Logan C.Y., Wang B., Nusse R. Tissue Repair in the Mouse Liver Following Acute Carbon Tetrachloride Depends on Injury-Induced Wnt/β-Catenin Signaling. Hepatology. 2019;69:2623–2635. - PMC - PubMed

LinkOut - more resources