. 2025 Jun:96:102123.
doi: 10.1016/j.molmet.2025.102123. Epub 2025 Mar 20.

Peptidylglycine alpha-amidating monooxygenase is important in mice for beta-cell cilia formation and insulin secretion but promotes diabetes risk through beta-cell independent mechanisms

Affiliations

Peptidylglycine alpha-amidating monooxygenase is important in mice for beta-cell cilia formation and insulin secretion but promotes diabetes risk through beta-cell independent mechanisms

Yi-Chun Chen et al. Mol Metab. 2025 Jun.

Abstract

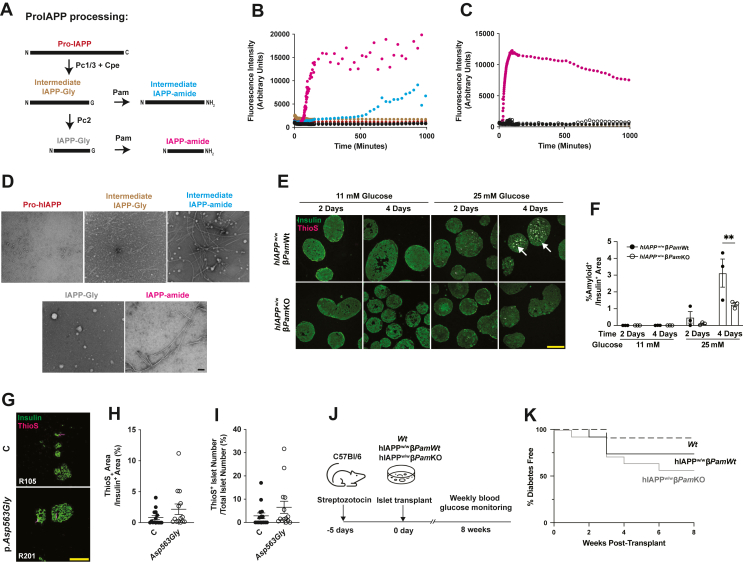
Objectives: Carriers of PAM (peptidylglycine alpha-amidating monooxygenase) coding variant alleles have reduced insulinogenic index, higher risk of developing type 2 diabetes (T2D), and islets from heterozygous carriers of the PAM p.Asp563Gly variant display reduced insulin secretion. Exactly how global PAM deficiency contributes to hyperglycemia remains unclear. PAM is the only enzyme capable of converting glycine-extended peptide hormones into amidated products. Like neuropeptide Y (NPY), α-melanocyte stimulating hormone (αMSH), and glucagon-like peptide 1 (GLP-1), islet amyloid polypeptide (IAPP), a beta cell peptide that forms islet amyloid in type 2 diabetes, is a PAM substrate. We hypothesized that Pam deficiency limited to beta cells would lead to reduced insulin secretion, prevent the production of amidated IAPP, and reveal the extent to which loss of Pam in β-cells could accelerate the onset of hyperglycemia in mice.

Methods: PAM activity was assessed in human islets from donors based on their PAM genotype. We generated beta cell-specific Pam knockout (Ins1Cre/+, Pamfl/fl; βPamKO) mice and performed islet culture, histological, and metabolic assays to evaluate the physiological roles of Pam in beta cells. We analyzed human IAPP (hIAPP) amyloid fibril forming kinetics using synthetic amidated and non-amidated hIAPP peptides, and generated hIAPP knock-in beta cell-specific Pam knockout (hIAPPw/w βPamKO) mice to determine the impact of hIAPP amidation on islet amyloid burden, islet graft survival, and glucose tolerance.

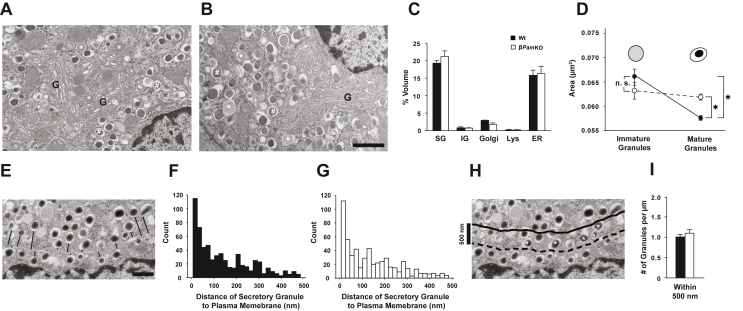
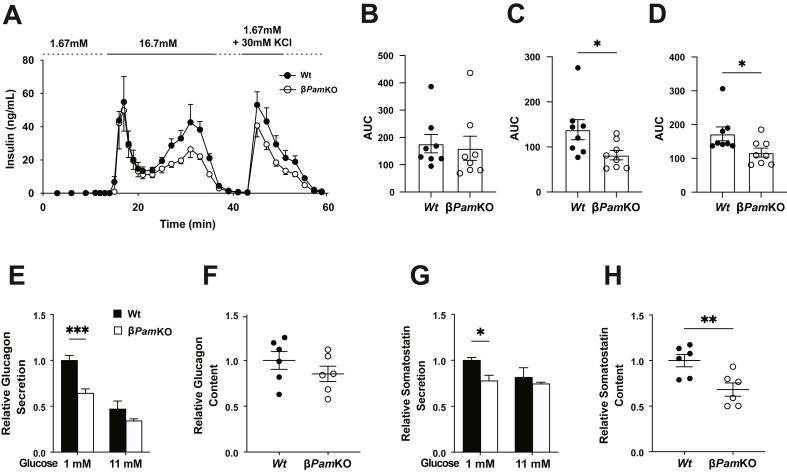
Results: PAM enzyme activity was significantly reduced in islets from donors with the PAM p. Asp563Gly T2D-risk allele. Islets from βPamKO mice had impaired second-phase glucose- and KCl-induced insulin secretion. Beta cells from βPamKO mice had larger dense-core granules and fewer and shorter cilia. Interestingly, non-amidated hIAPP was less fibrillogenic in vitro, and high glucose-treated hIAPPw/w βPamKO islets had reduced amyloid burden. Despite these changes in beta cell function, βPamKO mice were not more susceptible to diet-induced hyperglycemia. In vitro beta cell death and in vivo islet graft survival remained comparable between hIAPPw/w βPamKO and hIAPPw/w islets. Surprisingly, aged hIAPPw/w βPamKO mice had improved insulin secretion and glucose tolerance.

Conclusions: Eliminating Pam expression only in beta cells leads to morphological changes in insulin granules, reduced insulin secretion, reduced hIAPP amyloid burden and altered ciliogenesis. However, in mice beta-cell Pam deficiency has no impact on the development of diet- or hIAPP-induced hyperglycemia. Our data are consistent with current studies revealing ancient, highly conserved roles for peptidergic signaling in the coordination of the diverse signals needed to regulate fundamental processes such as glucose homeostasis.

Keywords: Insulin granules; Islet amyloid polypeptide; Islet cilia; Peptide hormone amidation; Type 2 diabetes risk gene.


Conflict of interest statement

Declaration of competing interest The authors declare the following financial interests/personal relationships which may be considered as potential competing interests: A.L.G's spouse is an employee of Genentech and holds stock options in Roche. If there are other authors, they declare that they have no known competing financial interests or personal relationships that could have appeared to influence the work reported in this paper.

Figures

Figure 1
Figure 1
Reduced islet PAM activity in p.Asp563Gly-PAM variant carriers. (A) Representative immunofluorescence images of human pancreatic sections of control (C) and p.Asp563Gly-PAM variant carriers (p.Asp563Gly) with antibodies that target insulin and amidated IAPP (upper panels), or insulin and non-amidated IAPP (lower panels). (BD) Quantitative analysis of amidated IAPP, non-amidated IAPP, and insulin expression levels in islets of control and PAM variant carriers. MFI, mean fluorescence intensity. (E) Representative immunofluorescence images of islets from wild-type (Wt) and beta cell-specific Pam knockout (βPamKO) mice using antibodies that target insulin, glucagon and Pam. Scale bar = 100 μm. Data are presented as mean ± SEM, ∗p < 0.05.
Figure 2
Figure 2
Altered organelle morphology in Pam knockout beta cells. In both Wt(A) and βPamKO (B) beta cells, Golgi stacks (G) were surrounded by mature secretory granules: ∗ denotes typical immature secretory granules; # denotes typical mature secretory granules. Scale bar = 1 μm. (C) The cytoplasmic volume fractions of mature secretory granules (SG), immature secretory granules (IMG), Golgi stacks, lysosomes (Lys) and endoplasmic reticulum (ER) are similar in Wt (black columns) and βPamKO (white columns) beta cells. n = 4 mice; 18 and 26 islets per genotype, 40 images per mouse, data are expressed as mean ± SE. (D) Transection areas in μm2 of immature secretory granules and mature secretory granules in Wt beta cells (black circles) and βPamKO beta cells (empty circles) (schematically depicted above). n > 260 immature secretory granules per genotype, and n > 1800 mature secretory granules per genotype. Data are expressed as mean ± SE. n. s. = not statistically significant; ∗ = p < 0.001. Representative micrograph (E) and quantitative analysis of distances between the plasma membrane and the closest membrane of peripheral secretory granules in Wt(F) and βPamKO (G) beta cells. n > 560 measurements per genotype. Scale bar = 500 nm. Representative micrograph (H) of readily releasable granules (situated within the peripheral zone, 500 nm from the plasma membrane, which is marked by the dashed line) and quantitative analysis (i) of numbers of secretory granules situated within the peripheral zone in Wt (black column) and βPamKO (white column) beta cells. n > 730 granules per genotype. Vertical scale bar = 500 nm. Data are expressed as mean ± SE. ∗p < 0.05.
Figure 3
Figure 3
Reduced islet hormone secretion in beta-cell Pam knockout islets. (A) Perifused islets were used to examine insulin secretion dynamics in Wt and βPamKO mice. Islets were exposed to 1.67 mM glucose for 15 min (basal secretion), to 16.7 mM glucose for 20 min and then to 1.67 mM glucose with 30 mM KCl for 10 min; samples were collected every minute, with selected timepoints analyzed by insulin ELISA. Area-under-curve (AUC) analysis of first-phase (B), second-phase (C), and KCl-stimulated (D) insulin secretion in islets from Wt and βPamKO mice. (E, F) Glucagon secretion and glucagon content, and (G, H) somatostatin secretion and somatostatin content of Wt (filled bar) and βPamKO (empty bar) islets. Data are presented as mean ± SEM. n ≥ 3 mice per group, ∗p < 0.05.
Figure 4
Figure 4
Altered primary cilia and islet cell distribution in beta-cell Pam knockout islets. (A) Representative immunofluorescence images of primary cilia in Wt and βPamKO islets. Scale bar = 50 μm Quantitative analysis of cilia length (B) and density (C) in Wt and βPamKO islets. In total, 12086 cilia from 42 islets from 4 Wt mice, and 6239 cilia from 30 islets from 4 βPamKO mice were analyzed. (D) Representative immunofluorescence images of islet cell distribution in Wt and βPamKO mice. Scale bar = 100 μm (EG) Percentage of insulin-positive (Ins+), glucagon-positive (Gcg+), and somatostatin-positive (Sst+) cells in islets of Wt and βPamKO mice. Each dot represents average percentage of Ins+, Gcg+, or Sst+ cells in islets from n = 10 (Wt) and 7 (βPamKO) mice. Representative tiled immunofluorescence images (scale bar = 5 mm) (H) and quantitative analysis of insulin-positive cells in the pancreas of Wt (n = 10) and βPamKO (n = 7) mice (i). Data are presented as mean ± SEM. ∗p < 0.05.
Figure 5
Figure 5
Beta-cell Pam knockout mice do not display impaired glucose tolerance. Male Wt (filled black circle), beta cell specific Pam heterozygous knockout (βPamHET, filled grey circle), and βPamKO (empty circle) mice were fed a 10% fat diet (AC) or a 45% fat diet (DF) for 20 weeks, their body weights (A, D) and fasting blood glucose levels (B, E) were monitored every two weeks. At 16 weeks post-diet treatment, intraperitoneal glucose tolerance test (IPGTT) was performed (C, F). Female Wt, βPamHET, and βPamKO mice were fed a 10% fat diet (GI) or a 45% fat diet (Jl) for 20 weeks, their body weights (G, J) and fasting blood glucose levels (H, K) were monitored every two weeks. At 16 weeks post-diet treatment, IPGTT was performed (I, L). (M) Islet Pam transcript levels were analyzed at 2 weeks after tamoxifen treatment. IPGTT was performed on male (N, O) and female (P, Q) inducible beta cell-specific Pam knockout (iβPamKO) mice at 9 weeks after tamoxifen treatment, and the area under the glucose excursion curve was analyzed. Data are presented as mean ± SEM. n ≥ 7 mice per group, ∗p < 0.05.
Figure 6
Figure 6
Fibril-forming capacity of non-amidated hIAPP is reduced, yet hIAPP-expressing beta-cell Pam knockout islets have similar transplant survival rates compared to Wt islets. (A) Schematic presentation of pro-IAPP processing pathway. (B) Thioflavin T-binding kinetics of hIAPP-amide (magenta), intermediate hIAPP-amide (blue), intermediate hIAPP-Gly (brown), hIAPP-Gly (grey), full-length prohIAPP (crimson), rodent IAPP (black), and buffer (white). (C) Thioflavin T-binding kinetics of hIAPP-amide (magenta), a combination of intermediate hIAPP-Gly and hIAPP-amide cocktail (brown), a combination of hIAPP-Gly and hIAPP-amide cocktail (grey), a combination of rodent IAPP and hIAPP-amide cocktail (black), and buffer (white). All peptides were mixed in 1:1 ratio (molar concentration). (D) Representative electron micrographs of hIAPP aggregates or fibrils from full-length prohIAPP, intermediate non-amidated hIAPP, intermediate amidated hIAPP, non-amidated hIAPP, and amidated hIAPP synthetic peptides. Scale bar = 100 nM (e) Representative images (scale bar = 100 μm) and (F) quantification of thioflavin S staining-positive amyloid fibrils in islets from control hIAPP knock-in (hIAPPw/w, filled circle) and hIAPP knock-in βPamKO (hIAPPw/w βPamKO, empty circle) mice. (G) Representative immunofluorescence images of insulin and thioflavin S staining in control (C) and p.Asp563Gly-PAM variant carriers (p.Asp563Gly). Scale bar = 100 μm. (H, I) Quantitative analysis of islet amyloid area and percentage of amyloid-containing islet from control vs. p. Asp563Gly donors. (J) Schematic of islet transplantation experiment. (K) Diabetes incidence (2 consecutive blood glucose measurements >20 mM) of hyperglycemic mice receiving Wt, hIAPPw/w, or hIAPPw/w βPamKO islets. Data are presented as mean ± SEM. n ≥ 3 mice per group for the in vitro islet culture experiments, and n ≥ 7 per group in the islet transplant experiment. ∗p < 0.05.
Figure 7
Figure 7
Improved glucose tolerance in hIAPP knock-in beta-cell Pam knockout mice. Intraperitoneal glucose tolerance test (IPGTT) was performed on 2-month-old male (A, B) and female (C, D)hIAPP knock-in βPamKO (hIAPPw/w βPamKO) and control hIAPPw/w mice, and area under the glucose excursion curve (AUC) was analyzed. Plasma insulin levels during oral glucose tolerance test, as well as areas under the plasma insulin excursion curve were analyzed in male (E, F) and female (G, H)hIAPPw/w βPamKO and control hIAPPw/w mice. IPGTT was performed on 6-month-old male (I, J) and female (K, L)hIAPPw/w βPamKO and control hIAPPw/w mice. Body weight, insulin tolerance, and area above glucose excursion curve (AAC) during insulin tolerance test were analyzed in 6-month-old male (MO) and female (PR)hIAPPw/w βPamKO and hIAPPw/w mice. Data are presented as mean ± SEM. n ≥ 5 mice per group, ∗p < 0.05.

References

    1. Krentz N.A.J., Gloyn A.L. Insights into pancreatic islet cell dysfunction from type 2 diabetes mellitus genetics. Nat Rev Endocrinol. 2020;16(4):202–212. doi: 10.1038/s41574-020-0325-0. - DOI - PubMed
    1. Steinthorsdottir V., Thorleifsson G., Sulem P., Helgason H., Grarup N., Sigurdsson A., et al. Identification of low-frequency and rare sequence variants associated with elevated or reduced risk of type 2 diabetes. Nat Genet. 2014;46(3):294–298. doi: 10.1038/ng.2882. - DOI - PubMed
    1. Fuchsberger C., Flannick J., Teslovich T.M., Mahajan A., Agarwala V., Gaulton K.J., et al. The genetic architecture of type 2 diabetes. Nature. 2016;536(7614):41–47. doi: 10.1038/nature18642. - DOI - PMC - PubMed
    1. Lek M., Karczewski K.J., Minikel E.V., Samocha K.E., Banks E., Fennell T., et al. Analysis of protein-coding genetic variation in 60,706 humans. Nature. 2016;536(7616):285–291. doi: 10.1038/nature19057. - DOI - PMC - PubMed
    1. Xue A., Wu Y., Zhu Z., Zhang F., Kemper K.E., Zheng Z., et al. Genome-wide association analyses identify 143 risk variants and putative regulatory mechanisms for type 2 diabetes. Nat Commun. 2018;9(1):2941. doi: 10.1038/s41467-018-04951-w. - DOI - PMC - PubMed