. 2025 Mar 22;13(3):e010057.
doi: 10.1136/jitc-2024-010057.

Depletion of tumor-derived CXCL5 improves T cell infiltration and anti-PD-1 therapy response in an obese model of pancreatic cancer

Affiliations

Depletion of tumor-derived CXCL5 improves T cell infiltration and anti-PD-1 therapy response in an obese model of pancreatic cancer

Richard McKinnon Walsh et al. J Immunother Cancer. .

Abstract

Background: CXCR1/2 inhibitors are being implemented with immunotherapies in PDAC clinical trials. CXC-ligands are a family of cytokines responsible for stimulating these receptors; while typically secreted by activated immune cells, fibroblasts, and even adipocytes, they are also secreted by immune-evasive cancer cells. CXC-ligand release is known to occur in response to inflammatory stimuli. Adipose tissue is an endocrine organ and a source of inflammatory signaling peptides. Importantly, adipose-derived cytokines and chemokines are implicated as potential drivers of tumor cell immune evasion; cumulatively, these findings suggest that targeting CXC-ligands may be beneficial in the context of obesity.

Methods: RNA-sequencing of human PDAC cell lines was used to assess influences of adipose conditioned media on the cancer cell transcriptome. The adipose-induced secretome of PDAC cells was validated with ELISA for induction of CXCL5 secretion. Human tissue data from CPTAC was used to correlate IL-1β and TNF expression with both CXCL5 mRNA and protein levels. CRISPR-Cas9 was used to knockout CXCL5 from a murine PDAC KPC cell line to assess orthotopic tumor studies in syngeneic, diet-induced obese mice. Flow cytometry and immunohistochemistry were used to compare the immune profiles between tumors with or without CXCL5. Mice-bearing CXCL5 competent or deficient tumors were monitored for differential tumor size in response to anti-PD-1 immune checkpoint blockade therapy.

Results: Human adipose tissue conditioned media stimulates CXCL5 secretion from PDAC cells via either IL-1β or TNF; neutralization of both is required to significantly block the release of CXCL5 from tumor cells. Ablation of CXCL5 from tumors promoted an enriched immune phenotype with an unanticipatedly increased number of exhausted CD8 T cells. Application of anti-PD-1 treatment to control tumors failed to alter tumor growth, yet treatment of CXCL5-deficient tumors showed response by significantly diminished tumor mass.

Conclusions: In summary, our findings show that both TNF and IL-1β can stimulate CXCL5 release from PDAC cells in vitro, which correlates with expression in patient data. CXCL5 depletion in vivo alone is sufficient to promote T cell infiltration into tumors, increasing efficacy and requiring checkpoint blockade inhibition to alleviate tumor burden.

Keywords: Adenocarcinoma; Gastrointestinal Cancer; Immune Checkpoint Inhibitor.


Conflict of interest statement

Competing interests: None declared.

Figures

Figure 1
Figure 1. (A) Schematic (Created in BioRender Walsh, R (2024) https://BioRender.com/o20p233) illustrating human adipose tissue conditioned media (hAT-CM) collection, storage, and application. Human adipose tissue is incubated in serum-free media at a 1:8 w/v ratio for 1 hour as a wash, then incubated for 24 hours in fresh serum-free media to collect adipose-associated factors. Media is collected and spun to remove cells and debris, then aliquoted, frozen, and diluted for application in functional assays. (B) Proliferation measured by flow cytometry for EdU incorporation into cells in vitro in response to stimulus with pooled hAT-CM diluted 1:3 in Serum Free DMEM (red triangles), Serum Free DMEM (black open squares), or 10% fetal bovine serum (FBS) supplemented DMEM (black open circles). Immortalized pancreatic ductal HPNE-G12D cells and Pancreatic Ductal Adenocarcinoma (PDAC) tumor cell lines (Panc1 and MiaPaCa2) were treated with diluted hAT-CM, serum-free media, or complete media for 24 hours. Then, EdU was spiked and mixed into the media to reach a final concentration of 10 µM for 6 hours to measure incorporation and active proliferation by flow cytometry to show that hAT-CM can induce proliferation of cancer cells in vitro: PI was used as a counter stain following fixation and permeabilization to quantify the total number of cells, and double positive EdU+PI+ events were quantified as a percentage of total PI+events. (C) Kaplan-Meier plot for CXCL5 high or low patients was generated using GEPIA showing significant differences in overall survival between the upper and lower half expressing patients in the PAAD-TCGA dataset±CI, p=0.024, n=89 patients for each dataset compared. (D) mRNA (left) and relative protein abundance (right) of normal (blue) and tumor (red) tissue shows increased mRNA expression and protein abundance of CXCL5 in tumor compared with adjacent normal tissue (CPTAC-cProSite). mRNA expression: n=39 for normal, n=138 for tumor; protein abundance: n=65 for normal, n=135 for tumor. The dashed line across each sample represents mean expression or abundance. (E) 24-hour stimulation of cells with hAT-CM shows CXCL5 in the media of the stimulated cells measured by ELISA normalized to serum free (SF) values, or compared with treatment with 1% FBS containing media; n=2 wells per treatment. Statistical analyses were performed using Brown-Forsythe and Welch corrected one-Way ANOVA in GraphPad Prism for (B) (EdU proliferation). CPTAC data (D) failed normality testing (S1D-E), therefore, the Mann-Whitney test was applied to CPTAC data to compare normal and tumor mRNA and protein abundance. P values <0.05 were considered significant and displayed up to four decimals. Error bars represent SD. ANOVA, analysis of variance.
Figure 2
Figure 2. Eight individual **hAT-CM samples (four male, three female, and one non-reported sex of varying BMIs/stages, see online supplemental table 1) or two replicates of serum-free media were applied to the indicated cells in separate wells in cell culture in six well plates. RNA was isolated from each well and subjected to RNA sequencing analysis to assess the response of HPNE-G12D, Panc1, and MiaPaCa2 cells to hAT-CM (n=8, diluted 1:3 in serum-free media) versus serum-free conditions (n=2). (A) Volcano plots displaying differential gene expression in response to hAT-CM treatment across three cell lines: HPNE-G12D, Panc1, and MiaPaCa2, versus serum-free incubation. (B) Differentially expressed genes were subjected to Upstream Analysis using Qiagen Ingenuity Pathway Analysis (IPA); IPA was used to predict upstream signaling pathways (cytokines, growth factors, receptors) activated across all three cell lines tested in response to hAT-CM. The z-scores of the 27 (*) overlapping signaling pathways with positive z-scores, indicating potential influence on the cellular transcriptomes, were plotted in a heatmap in order of clustering in IPA (C). The top two hits (TNF and IL-1β) are expanded out (D, E) to visualize averaged log2FC versus serum free conditions for all genes associated with the pathway and their differential expression across cell lines in a heatmap clustered by Clustergrammer (see online supplemental figure 2C for permanent links to interactive plots prepared using Average linkage and Cosine distance, and online supplemental table 3 for the gene list/values input into Clustergrammer); Red=positive FC, Blue=Negative FC. Range for (D)=−2.38:7.73 across 200 pathway associated genes, (E)=−1.86:7.73 across 136 IL-1β associated genes. 94 genes overlap across both groups. (F) P values of TNF and IL-1β upstream pathway activity from IPA are plotted for each cell line. **6/8 samples received no neoadjuvant therapy, while 2/8 were not reported or treatment history was not found. Abbreviations: BMI, body mass index; hAT-CM, human adipose tissue conditioned media; IPA, ingenuity pathway analysis.
Figure 3
Figure 3. (A) RNA and protein data accessed from cProSite (platform for accessing NCI CPTAC and ICPC data derived from Proteomic Data Commons) were used to plot Pearson correlation of IL-1β mRNA (left) or TNF (right) mRNA with CXCL5. IL-1β and TNF mRNA were plotted against CXCL5 mRNA expression (top) or protein abundance (bottom) to show correlation of CXCL5 expression and abundance. IL-1β and TNF were not detected at the protein level; therefore, only mRNA was used for correlation analysis against CXCL5 expression or abundance. Data were analyzed in GraphPad Prism using the Simple linear regression function to calculate r and p values using Pearson correlation. (B) hAT-CM of pooled obese samples (BMI≥30; see online supplemental table 1 for associated samples and patient information) or recombinant IL-1β, TNF, or combo (1 µg/mL each) was used to stimulate CXCL5 release. Neutralizing antibodies against IL-1β or TNF were applied at 1 µg/mL to inhibit CXCL5 secretion in the presence of hAT-CM. Each treated group of Panc1 cells was treated for 36 hours and tumor conditioned media was collected, spun to remove cells, and CXCL5 levels secreted into the media were measured by ELISA. Statistics for (B) were performed by Brown-Forsythe and Welch’s one way ANOVA, and only significant p values are displayed. n=3 for hAT-CM treated groups. n=4 for recombinant protein stimulus groups. (A) Error bars represent 95% CI and (B) error bars represent ±SD. ANOVA, analysis of variance; BMI, body mass index; hAT-CM, human adipose tissue conditioned media.
Figure 4
Figure 4. (A) Depletion of tumor CXCL5 was validated in murine Pancreatic Ductal Adenocarcinoma (PDAC) cell lines (K8484-KPC) by qPCR and normalized to non-targeting control guide RNA (NTC) levels. (B) Proliferation of the cells in vitro was measured by EdU incorporation over a 6-hour time period in 5% FBS DMEM (n=4 for NTC; 8/gRNA=2*4/clone). (C) In vivo study timeline: the Cas9+non-targeting control guide RNA carrying cells (CTRL) or pooled knockout clones (3–15+3-17: KO3), or (45–4+45-15: KO45) were then orthotopically injected (500k total cells in 50 µL Geltrex/injection) into the pancreas of syngeneic Jax/B6 mice maintained on high-fat/Western style diet for a minimum of 3 months. Tumors were allowed to grow for 29 days prior to takedown. Tumors were assessed for tumor mass in grams (D) and live (Live Dead stain negative) cells were assessed for myeloid (CD11b+) immune markers by flow cytometry (E–I): CD206-/MHCII+cells were considered potential antigen-presenting cells (APCs) from the LiveDead-/CD11b+positive population. Ly6G-, Ly6Chi CD11b+cells were considered potential monocytic myeloid-derived suppressor cells (MDSCs) from the LiveDead-/CD11b+population. CXCR4+ and CXCR4− events from Ly6G/CD11b+/LiveDead− cells were considered potential N1 and N2 neutrophils, respectively. Immunofluorescent staining of formalin-fixed paraffin-embedded tumor tissue sections for Arginase I (ARG1, red) counterstained with Hoechst nuclear dye (blue) was used to mark and quantify relative ARG1 abundance (ARG1+area/Hoechst area quantified in ImageJ) by microscopy at (imaged at 20×: scale bars represent 125 µm) indicating immunosuppressive stromal elements (J). Representative images of control (top) and knockout tumors (bottom) for quantification (right); three images were taken per tumor and averaged to provide values for quantification for each individual tumor plotted (n=6 CTRL, n=9 KO). Statistics were performed by Brown-Forsythe and Welch’s one way ANOVA (B, D), or unpaired t-test with Welch’s corrections in GraphPad Prism (E–J). Error bars are displayed as ±SD. ANOVA, analysis of variance; FBS, fetal bovine serum.
Figure 5
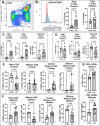
Figure 5. (A) Representative FlowJo plot of CD11b (y-axis) versus CD45 (x-axis) staining from CXCL5KO tumor depicting CD11b− CD45+ population of interest. (B) Cells were gated for CD45 positivity then plotted for CD3 positivity: Representative histogram of CD3 staining in CXCL5KO (T32P, tumor KO3, number 2, blue) tumor versus control (TP2, red) and quantification of CD3+cells as percentage of CD45+cells in tumors shows significantly greater CD3 T cell infiltration in CXCL5KO tumors (middle), but no difference in spleen abundance (right) of mice bearing control or CXCL5KO KPC tumors. Quantification of CD8+ or CD4+ cells as a percentage of CD45+Live cells (gated prior for negative Live/Dead stain and CD45 positivity) shows an increase in CXCL5KO tumors (C) but not spleens (D). CD8 polarization is shown as naïve, effector, central memory, or effector memory CD8 T cells from tumor (E) or spleens (F) distinguished by CD62L and CD44 axes: central memory CD8 T cells (CD62L+CD44+) are increased in CXCL5KO tumor-bearing mice in both tumors and spleens. PD1 positivity of the CD8+ population of T cells is greater in tumors (top) and spleens (bottom) of CXCL5KO tumor-bearing mice compared with control (G). (n=6 CTRL, n=8 KO) Statistics: Unpaired T-test with Welch’s corrections in GraphPad Prism (E–J). Error bars are displayed as ±SD.
Figure 6
Figure 6. (A) Schematic depicting study timeline: Syngeneic, Jax/B6 mice were fed a high-fat/Western style diet to drive diet-induced obesity for a minimum of 3 months, then were orthotopically injected with either 1E6 Cas9+non-targeting control guide RNA (“CTRL”) or a 50/50 mix of Cas9+CXCL5 knockout clones 3–15 and 3–17 (“KO”) K8484-KPC cells, similar to figure 4B, resuspended in 50 µL Geltrex per injection. At day 10 post-tumor implantation, mice were treated with 200 µg in 100 µL volume of anti-PD-1 antibody (Clone 29F1A12) or IgG (Clone 2A3) diluted in InVivoPure pH 7.0 dilution buffer and continued every third day until day 22. Whole pancreas+tumor mass (g) was assessed at endpoint (d29) revealing statistically significant reduction in tumor mass only in KO tumors treated with anti-PD-1 therapy (B). Statistics were performed by Brown-Forsythe and Welch’s one way ANOVA, and all significant (p<0.05) p values are shown and considered significant; error bars are displayed as ±SD. n=5–6 per group. (C) Illustrative representation of study: Adipose tissue explants contain cytokines from adipocytes or monocytes that can stimulate CXCL5 release from Pancreatic Ductal Adenocarcinoma (PDAC) cells in vitro; CXCL5 acts as a critical deterrent to tumor T cell infiltration in in vivo studies where CXCL5 depletion permits intratumoral T cell infiltration. Illustration created in BioRender: Walsh (2024) https://BioRender.com/h45s779. ANOVA, analysis of variance.

References

    1. Rahib L, Wehner MR, Matrisian LM, et al. Estimated Projection of US Cancer Incidence and Death to 2040. JAMA Netw Open . 2021;4:e214708. doi: 10.1001/jamanetworkopen.2021.4708. - DOI - PMC - PubMed
    1. Arslan AA, Helzlsouer KJ, Kooperberg C, et al. Anthropometric measures, body mass index, and pancreatic cancer: a pooled analysis from the Pancreatic Cancer Cohort Consortium (PanScan) Arch Intern Med. 2010;170:791–802. doi: 10.1001/archinternmed.2010.63. - DOI - PMC - PubMed
    1. Li D, Morris JS, Liu J, et al. Body mass index and risk, age of onset, and survival in patients with pancreatic cancer. JAMA. 2009;301:2553–62. doi: 10.1001/jama.2009.886. - DOI - PMC - PubMed
    1. VanSaun MN, Lee IK, Washington MK, et al. High fat diet induced hepatic steatosis establishes a permissive microenvironment for colorectal metastases and promotes primary dysplasia in a murine model. Am J Pathol. 2009;175:355–64. doi: 10.2353/ajpath.2009.080703. - DOI - PMC - PubMed
    1. Chung KM, Singh J, Lawres L, et al. Endocrine-Exocrine Signaling Drives Obesity-Associated Pancreatic Ductal Adenocarcinoma. Cell. 2020;181:832–47. doi: 10.1016/j.cell.2020.03.062. - DOI - PMC - PubMed

MeSH terms

Substances