. 2025 Mar 22;11(1):48.
doi: 10.1038/s41522-025-00676-z.

Bacterial membrane vesicles restore gut anaerobiosis

Affiliations

Bacterial membrane vesicles restore gut anaerobiosis

Norman Pitt et al. NPJ Biofilms Microbiomes. .

Abstract

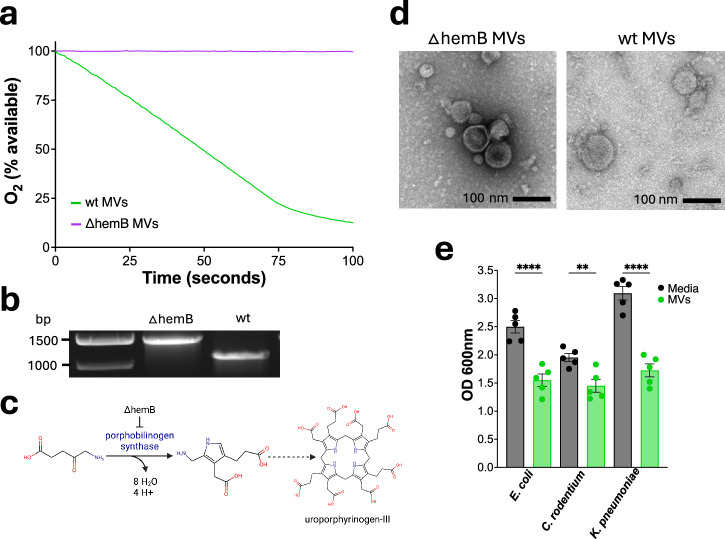
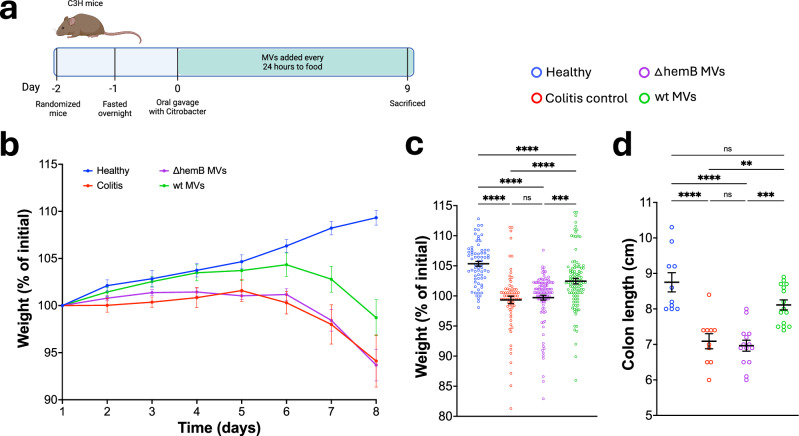
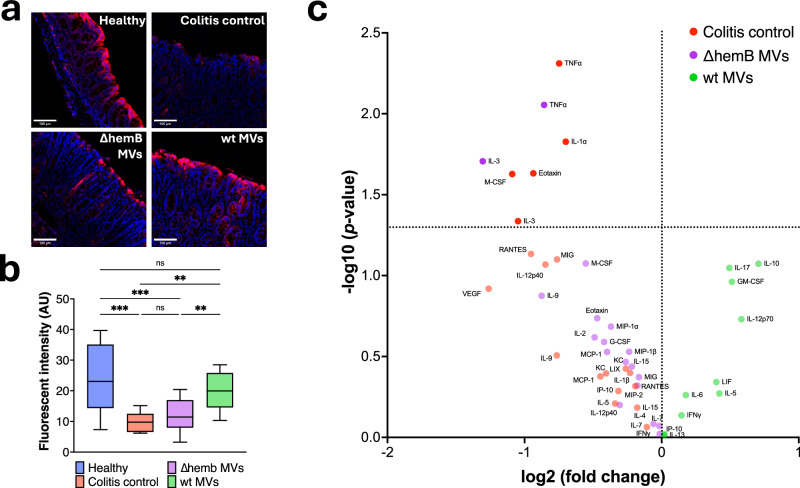
Inflammation damages the epithelial cell barrier, allowing oxygen to leak into the lumen of the gut. Respiring E. coli and other Enterobacteriaceae produce proinflammatory lipopolysaccharide, exacerbating inflammatory bowel disease. Here we show that respiring membrane vesicles (MV) from E. coli ameliorate symptoms in a mouse model of gut inflammation. Membrane vesicle treatment diminished weight loss and limited shortening of the colon. Notably, oxygenation of the colonic epithelium was significantly decreased in animals receiving wild type MVs, but not MVs from an E. coli mutant lacking cytochromes. Metatranscriptomic analysis of the microbiome shows an increase in anaerobic Lactobacillaceae and a decrease in Enterobacteriaceae, as well as a general shift towards fermentation in MV-treated mice. This is accompanied by a decrease in proinflammatory TNF-α. We report that MVs may lead to the development of a novel type of a therapeutic for dysbiosis, and for treating IBD.


Conflict of interest statement

Competing interests: K.L. and N.P. are inventors on a patent application related to this work filed by Northeastern University: Provisional Patent Application No. 63/697942. The authors declare that they have no other competing interests.

Figures

Fig. 1
Fig. 1. Membrane vesicles inhibit the growth of pro-inflammatory Enterobacteriaceae by consuming oxygen.
a Respiration of membrane vesicles. The medium contained 20 mM potassium phosphate, 650 mM succinate at a pH of 7 with 325 µg/mL of either wt or ∆hemB MVs. b Electrophoresis on a 0.8% agarose gel for 1 h, hemB was amplified with P3 and P4 primers. Expected amplicon sizes for ∆hemB (hemB::kanR) were 1466 bp and wt hemB was 1114 bp. c Pathway of heme b biosynthesis from 5-aminolevulinate. d Transmission electron microscopy images of ∆hemB and wt MVs. e Cell density of Escherichia coli AR350, Klebsiella pneumoniae ATCC 43816, and Citrobacter rodentium ATCC 51459 after 7 hours of growth in LB aerobically and shaking at 37 °C n = 5 for all cultures. Cultures were inoculated with 1/400 dilution of overnight cultures, 13 mM succinate and 1.6 mg/mL of MVs. Statistical significance was determined using one-way ANOVA with Šídák’s multiple comparisons test, bars represent mean ± SEM. Adjusted p values were as follows, **p < 0.01, ****p < 0.0001.
Fig. 2
Fig. 2. Membrane vesicles ameliorate colitis.
a Schematic of the mouse experiment. b Body weight of mice as a percent of the initial weight recorded at day 1. Points represent the mean ± SEM. Healthy group n = 10, colitis control n = 10, ∆hemB MVs n = 15, and wt MVs n = 15. c Compiled percent of initial weight for each mouse from days 2 to 8. Healthy n = 70, colitis control n = 70, ∆hemB MVs n = 105, wt MVs n = 105. Line and error bars represent the mean ± SEM. Significance determined using Kruskal-Wallis test with Dunn’s multiple comparisons test. Adjusted p values were as follows, ***p = 0.0005, ****p < 0.0001. d Length of colon distal of the cecum. Healthy n = 10, colitis control n = 10, ∆hemB MVs n = 14, wt MVs n = 15. Bars represent the mean ± SEM. Significance determined using one-way ANOVA with Tukey’s multiple comparisons test. Adjusted p values were as follows, **p = 0.0021, ***p < 0.001, ****p < 0.0001.
Fig. 3
Fig. 3. Membrane vesicles reduce the colonic epithelium and modulate the cytokine response.
a Representative images of the distal colonic epithelium. Mice were injected intraperitoneally with pimonidazole 1 hour before euthanasia. Pimonidazole adducts were detected using Hypoxyprobe-1 RED ATTO 594 dye-conjugated IgG1 mouse monoclonal antipimonidazole antibody (red fluorescence). Hoechst 33342 was used as a nuclear counter stain (blue fluorescence). No adjustments were made to the images. b Quantification of the RED ATTO 594 dye. 3 sections of the distal epithelium were quantified and averaged per mouse, healthy n = 10, colitis control n = 10, ∆hemB MVs n = 14, and wt MVs n = 15. Box displays the range from the first to the third quartile, with a line at the median value, and Tukey whiskers. Significance was determined using one-way ANOVA with Šídák’s multiple comparisons test. Adjusted p values were as follows, *p = 0.0147, **p = 0.0024, ***p < 0.001. c Volcano plot displaying serum cytokines that were increased in, colitis control vs. wt membrane vesicles in red, ∆hemB MVs vs. wt MVs in purple, and wt MVs vs. colitis control and ∆hemB MVs in green.
Fig. 4
Fig. 4. Membrane vesicle treatment modifies the microbiome.
a PCoA of Bray-Curtis dissimilarity using bacterial genera as features. Each point represents a single sample, points are colored by groups. Healthy n = 10, colitis control n = 10, ∆hemB MVs n = 9, wt MVs n = 12. b Phylogenetic tree of all bacterial families identified in the samples. Heatmap depicts average z-score of each bacterial family within a group. Bars represent the average relative abundance of bacterial families within a group. c Bar graph showing the relative abundance of all bacterial genera identified in each sample, as well as the average for each group. d Linear regression for the relative abundance of Enterobacteriaceae to Lactobacillaceae within the colitis control, ∆hemb MVs and wt MVs groups. Each point represents a single sample (n = 31), best-fit line in red. e Top 5 LEfSe results represented by LDA-score of wt MVs group to ∆hemB MVs group. f Relative abundance of the top 5 LEfSe results between wt MVs group and colitis control or ∆hemB MVs group, only significant differences shown. All boxes display the range from the first to the third quartile, with a line at the median value, and Tukey whiskers. For Lactobacillaceae comparison significance was determined using Kruskal-Wallis test with Dunn’s multiple comparisons with adjusted p value, *p < 0.05. For all other comparisons significance was determined using a two-tailed Mann-Whitney test, p values were as follows, *p < 0.05, **p = 0.0073.
Fig. 5
Fig. 5. MV treatment alters the metatranscriptome and metabolome.
a PCoA of Bray-Curtis dissimilarity using SEED subsystems as features annotated using MEGAN. Each point represents a single sample, points are colored by groups, dashed arrows represent biplot vectors of the top two loadings. Healthy n = 10, colitis control n = 10, ∆hemB MVs n = 9, wt MVs n = 12. b Heatmap of all SEED energy subsystems annotated by MEGAN, clustered by subsystems (rows). c Selected energy subsystems that showed significant differences in number of assigned transcripts between wt MVs and either ∆hemB MVs or colitis control groups, organized into subcategories. All boxes display the range from the first to the third quartile, with a line at the median value, and Tukey whiskers. Significance was determined using one-way ANOVA test with Tukey’s multiple comparisons. d Principal component analysis from untargeted LCMS analysis with analytes as features. Each point represents a sample, and points are colored by group. Healthy n = 7, ∆hemB MVs n = 4, and wt MVs n = 4. e Comparison of peak area for glyceric acid between wt MVs and ∆hemB MVs, identified with LCMS and compound discoverer. Significance was determined using a two-tailed Mann-Whitney test, *p = 0.0286.

References

    1. Enck, P. et al. Irritable bowel syndrome. Nat. Rev. Dis. Prim.2, 16014 (2016). - PMC - PubMed
    1. Roda, G. et al. Crohn’s disease. Nat. Rev. Dis. Primers6. 10.1038/s41572-020-0156-2 (2020).
    1. Kobayashi, T. et al. Ulcerative colitis. Nat. Rev. Dis. Primers6. 10.1038/s41572-020-0205-x (2020). - PubMed
    1. Heston, M. B. et al. Gut inflammation associated with age and Alzheimer’s disease pathology: a human cohort study. Sci. Rep. 13. 10.1038/s41598-023-45929-z (2023). - PMC - PubMed
    1. Sochocka, M. et al. The Gut Microbiome Alterations and Inflammation-Driven Pathogenesis of Alzheimer’s Disease-a Critical Review. Mol. Neurobiol.56, 1841–1851 (2019). - PMC - PubMed

LinkOut - more resources