. 2025 Mar 22;8(1):174.
doi: 10.1038/s41746-025-01560-y.

Predicting response to neoadjuvant chemotherapy in muscle-invasive bladder cancer via interpretable multimodal deep learning

Affiliations

Predicting response to neoadjuvant chemotherapy in muscle-invasive bladder cancer via interpretable multimodal deep learning

Zilong Bai et al. NPJ Digit Med. .

Abstract

Building accurate prediction models and identifying predictive biomarkers for treatment response in Muscle-Invasive Bladder Cancer (MIBC) are essential for improving patient survival but remain challenging due to tumor heterogeneity, despite numerous related studies. To address this unmet need, we developed an interpretable Graph-based Multimodal Late Fusion (GMLF) deep learning framework. Integrating histopathology and cell type data from standard H&E images with gene expression profiles derived from RNA sequencing from the SWOG S1314-COXEN clinical trial (ClinicalTrials.gov NCT02177695 2014-06-25), GMLF uncovered new histopathological, cellular, and molecular determinants of response to neoadjuvant chemotherapy. Specifically, we identified key gene signatures that drive the predictive power of our model, including alterations in TP63, CCL5, and DCN. Our discovery can optimize treatment strategies for patients with MIBC, e.g., improving clinical outcomes, avoiding unnecessary treatment, and ultimately, bladder preservation. Additionally, our approach could be used to uncover predictors for other cancers.


Conflict of interest statement

Competing interests: Bishoy M Faltas: Consulting or Advisory Role: QED therapeutics, Boston Gene, Astrin Biosciences Merck, Immunomedics/Gilead, QED therapeutics, Guardant, Janssen. Patent Royalties: Immunomedics/Gilead. Research support: Eli Lilly. Honoraria: Urotoday. Grants and research support: NIH, DoD-CDMRP, Starr Cancer Consortium, P-1000 Consortium. Olivier Elemento: Stock and Other Ownership Interests: Freenome, OneThree Biotech, Owkin, Volastra Therapeutics. Personal fees: Pionyr Immunotherapeutics, Champions Oncology. Seth P Lerner: Research support for Clinical trials - Aura Bioscience, FKD, JBL (SWOG), Genentech (SWOG), Merck (Alliance), QED Therapeutics, Surge Therapeutics, Vaxiion; Consultant/Advisory Board - Aura Bioscience, BMS, C2iGenomics, Immunity Bio, Incyte, Gilead, Pfizer/EMD Serono, Protara, Surge Therapeutics, UroGen, Vaxiion, Verity; Patent – TCGA classifier; Honoraria – Grand Rounds Urology, UroToday. Zilong Bai, Mohamed Osman, Matthew Brendel, Catherine M. Tangen, Thomas W. Flaig, Ian M. Thompson, Melissa Plets, M. Scott Lucia, Dan Theodorescu, Daniel Gustafson, Siamak Daneshmand, Joshua J. Meeks, Woonyoung Choi, Colin P. N. Dinney, David J. McConkey, and Fei Wang declare no competing interests. Ethics approval: The study was reviewed and received approval by the National Cancer Institute (NCI) Central Institutional Review Board (CIRB), and patients provided written, informed consent; it was conducted according to the Declaration of Helsinki guidelines17.

Figures

Fig. 1
Fig. 1. The GMLF multimodal deep learning framework of Histology and Gene Expression Integration for Predicting Response to NAC.
Our model uses two paired data types from bladder cancer samples: gigapixel whole-slide images from routine Hematoxylin and Eosin (H&E) stained slides, and gene expression data from tissue microarrays. Our GMLF model consists of three branches: (1) WSI Neural Embeddings Branch: a GNN-based branch processing attributed graphs with nodal features as neural embeddings extracted by ResNet50 from WSIs, (2) WSI Cell-type and Morphological Branch: another GNN-based branch for graphs with nodal features comprising cell type and morphological features extracted by HoVer-Net from WSIs, and (3) Gene Expression Branch: a multilayer perceptron that processes the gene expression vector. Each branch i of the model yields a scalar score Si. We employ a multimodal late fusion strategy, aggregating these branch-level scores through summation, followed by Platt scaling to generate a prediction value. This value represents a probability between 0 and 1, where 1 indicates a complete response (pCR) to NAC.
Fig. 2
Fig. 2. Schematic diagram illustrating the two-strategy evaluation framework implemented in our study.
The dataset is initially split into an 80% discovery subset and a 20% hold-out test set, utilizing stratified random sampling at the patient level to ensure consistent data distribution among the different splits. Within the discovery subset, stratified 5-fold cross-validation is applied for model development and optimal parameter selection. The hold-out test set is then used to conduct an unbiased evaluation of the final model, assessing its performance on previously unseen data.
Fig. 3
Fig. 3. Rigorous evaluation of model performance via ablation study.
a Our comprehensive ablation study assesses the three-branch multimodal GMLF against different unimodal and bimodal baseline models formed based on the three distinct feature modalities. Specifically, Neural Embeddings refers to the GNN branch using ResNet50 for patch-level feature extraction, Cell Type and Morphology to another GNN branch using HoVer-Net for patch-level feature extraction, and Gene Expression to the branch analyzing patient-level gene expression data from tissue microarrays. b The AUROC (Area Under the Receiver Operating Characteristic) performance across different modality compositions is evaluated during the 5-fold cross-validation and tested on 20% internal validation data, with models trained on the 80% discovery dataset, for predicting response to neoadjuvant chemotherapy (NAC).
Fig. 4
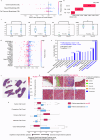
Fig. 4. Multilevel Multimodal Interpretation for GMLF.
a Modality-level importance attributions across all patients in the hold-out test dataset are analyzed using a SHAP-based interpretation approach on a modality-level proxy model. b SHAP-based modality-level importance attribution for a representative patient (SAEAMD-0BS5RI-A1). c Comparison of prediction scores between responder and non-responder groups for the three individual unimodal branches of our multimodal framework GMLF: Neural Embeddings (NE), Cell-type and Morphology (CM), and Gene Expression (GE), and the overall prediction score from GMLF for predicting response to NAC. P-values in the boxplot subfigures were computed using the Mann-Whitney U test, with “*” indicating P-values < 0.05. d Gene (per alias) importance attributions across all patients in the hold-out test dataset are determined by applying SHAP to a proxy model that inputs the gene expression feature vector alongside predictions from the two GNN branches. The top 20 are presented. e Gene set enrichment analysis of the selected top 111 genes selected according to their SHAP-based gene importance attributions. Statistical significance is assessed by the hypergeometric test, using the overall investigated gene list as a background. f Visualization of node importance for the cell type and morphology branch overlaid on the original H&E slide for slide SADREE-0BGNRK-1A, correctly predicted as complete response (pCR). g Representative patches around the top 10th quantile of nodal importance associated with non-pCR (top row) and pCR (bottom row), annotated with HoVer-Net-estimated cell types for the same slide as (f). h Analysis of cell-type specific distributions based on the most contributive patches - i.e., the top 25% extremes of patch importance per slide. Boxplots for the average patch-level cell counts or tumor-stromal ratios for no pCR (red) or pCR (blue) predictive patches normalized by the average patch-level cell-type specific attribute of the entire WSI, with each point representing a distinct slide. The dotted line represents the average patch-level attribute (cell count or tumor-stromal ratio) for a given slide, indicating no enrichment for a particular cell type.
Fig. 5
Fig. 5. MDR-based ITH quantification stratified by response status and its influence on model performance.
ITH quantification was computed with the Median Deviation Ranking (MDR) approach in (a) and (b). a Boxplots of ITH metrics from the WSIs in pCR and no pCR subgroups. P-values computed by the Mann-Whitney U test. b Model performance evaluated by AUROC in different quantile subgroups stratified by ITH quantification. The x-axis indicates k, the number of quantiles, which ranges from 2 to the largest number before the first appearance of invalid quantile subgroups for computing AUROC.

References

    1. Siegel, R. L., Miller, K. D., Fuchs, H. E. & Jemal, A. Cancer statistics, 2022. CA Cancer J. Clin.72, 7–33 (2022). - PubMed
    1. Park, J. C., Citrin, D. E., Agarwal, P. K. & Apolo, A. B. Multimodal management of muscle-invasive bladder cancer. Curr. Probl. Cancer38, 80–108 (2014). - PMC - PubMed
    1. Zakaria, A. S. et al. Postoperative mortality and complications after radical cystectomy for bladder cancer in Quebec: A population-based analysis during the years 2000-2009. Can. Urol. Assoc. J.8, 259–267 (2014). - PMC - PubMed
    1. Novara, G. et al. Complications and mortality after radical cystectomy for bladder transitional cell cancer. J. Urol. 10.1016/j.juro.2009.05.032 (2009). - PubMed
    1. Shabsigh, A. et al. Defining early morbidity of radical cystectomy for patients with bladder cancer using a standardized reporting methodology. Eur. Urol.55, 164–174 (2009). - PubMed

Associated data

LinkOut - more resources