. 2025 Mar 23;11(1):e004290.
doi: 10.1136/rmdopen-2024-004290.

Immunoglobulins G from Patients with Systemic Sclerosis Modify the Molecular Signatures of Endothelial Cells

Affiliations

Immunoglobulins G from Patients with Systemic Sclerosis Modify the Molecular Signatures of Endothelial Cells

Aurélien Chepy et al. RMD Open. .

Abstract

Objective: Antinuclear antibodies (ANA) are powerful biomarkers in systemic sclerosis (SSc). Functional antibodies (FA) might be implicated in vasculopathy, in which endothelial cells (EC) are key players. We aimed to explore the effect of purified IgG from patients with SSc on omics signatures of EC and examine the influence of ANA serotypes and FA.

Methods: EC were cultured in the presence of purified IgG from patients with SSc, patients with systemic lupus erythematosus (SLE) or healthy controls (HC). EC omics profiles were analysed by liquid chromatography with tandem mass spectrometry (LC-MS/MS) and RNA sequencing. EC proteome induced by IgG from patients with SSc was confirmed with an external validation cohort.

Results: In the derivation cohort, principal component analysis (PCA) using proteomics data showed three distinct groups of subjects: a first one including mostly anti-topoisomerase-I positive patients (ATA+), a second one including mostly anti-centromere positive patients and a third group comprising anti-RNA polymerase-III positive patients, SLE and HC. In transcriptomics, PCA distinguished one group composed of ATA+patients only from a second group mixing ATA+patients with other individuals. The validation cohort confirmed the existence of two groups of distinct EC proteome profiles and clinical severity in ATA+patients. In both SSc cohorts, no association between FA presence and proteomic profiles was observed. Quantitative proteomics measured the most discriminant proteins in EC exposed to purified IgG.

Conclusion: Purified IgG from patients with SSc can modify EC proteome and transcriptome. The observed changes closely associate with ANA serotype.

Keywords: Autoantibodies; Autoimmune Diseases; Scleroderma, Systemic.


Conflict of interest statement

Competing interests: AC reports a relationship with Vitalair that includes: travel reimbursement. DL reports consultancies and speaking fees from Biocryst Pharmaceuticals, Inc., CSL Behring LLC, Takeda Pharmaceutical Company Limited and research support from Biocryst Pharmaceuticals Inc., CSL Behring LLC, GSK, Octapharma, Pfizer Inc. and Takeda Pharmaceutical Company Limited (less than US$10 000), outside the submitted work. VS reports consultancies and speaking fees from Boehringer-Ingelheim, Fresenius Kabi, Grifols, Ultragenyx (less than US$10 000) and research support from Grifols, outside the submitted work. The remaining authors declare that the research was conducted in the absence of any commercial or financial relationships that could be construed as a potential conflict of interest.

Figures

Figure 1
Figure 1. Effect of total purified IgG from derivation cohort on EC omics profiles. PCA scatter plots for the analysed cell samples. (A) PCA highlights EC proteins assessed by LC-MS/MS and (B) mRNA expressions assessed by 3’ mRNA sequencing according to ANA serotypes. (C) The arrow plot represents variation between proteomics and transcriptomics in each individual. ATA(a) group expressed less variation and appeared more homogeneous. ACA+, anti-centromere positive patients; ANA, antinuclear antibodies; ARA+, anti-RNA polymerase-III positive patients; ATA+, anti-topoisomerase-I positive patients; EC, endothelial cells; HC, healthy controls; LC-MS/MS, liquid chromatography with tandem mass spectrometry; mRNA, messenger RNA; PCA, principal component analysis; PLS, partial least squares; SLE, patients with systemic lupus erythematosus.
Figure 2
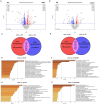
Figure 2. Effect of total purified IgG ATA+ and ACA+ on endothelial cells proteome in derivation cohort. Volcano-plots represent differential analysis (A) between ATA+ versus HC and (B) ACA+ versus HC comparisons. Commonly (C) overexpressed and (D) underexpressed proteins in the comparisons ATA+ versus HC and ACA+ versus HC are provided. Enrichment analysis in (E) upregulated DEP and (F) downregulated DEP in ATA+group. Enrichment analysis in (G) upregulated DEP and (H) downregulated DEP ACA+group. ACA+, anti-centromere positive patients; ATA+, anti-topoisomerase-I positive patients; DEP, differentially expressed proteins; HC, healthy controls.
Figure 3
Figure 3. Effect of total purified IgG ATA+ on endothelial cells transcriptome in the derivation cohort. Volcano-plots represent differential analysis between (A) ATA+ versus HC (B) ATA+(a) versus HC. Enrichment analysis of (C) upregulated DEG in ATA+(a) versus HC and (D) downregulated DEG in ATA+(a) versus HC. ATA+, anti-topoisomerase-I positive patients; ATA+(a), anti-topoisomerase-I positive patients group a; DEG, differentially expressed genes; HC, healthy controls.
Figure 4
Figure 4. Effect of total purified IgG from on EC proteome in the validation cohort. PCA scatter plots for the analysed cell samples. (A) PCA highlights EC proteins expression assessed by LC-MS/MS according to ANA serotypes in the validation cohort. (B) Sankey plot represents commonly overexpressed and underexpressed proteins among derivation and validation cohort. Enrichment analysis of (C) commonly upregulated DEG in ATA+(a) versus HC and (D) commonly downregulated DEG in ATA+(a) versus HC in both cohorts. ACA+, anti-centromere positive patients; ARA+, anti-RNA polymerase-III positive patients; ATA+, anti-topoisomerase-I positive patients; ATA+(a), anti-topoisomerase-I positive patients group a; EC, endothelial cells; HC, healthy controls; LC-MS/MS, liquid chromatography with tandem mass spectrometry; PCA, principal component analysis.
Figure 5
Figure 5. Impact of FA on omics profiles. PLS-DA axes according to FA levels in (A) derivation cohort proteomic profiles, (B) derivation cohort transcriptomic profiles and in (C) validation cohort proteomic profiles. AT1R, angiotensin II type 1 receptor autoantibodies; ETAR, endothelin-1 type A receptor autoantibodies; FA, functional antibodies; PLS-DA, partial least squares-discriminant analysis.
Figure 6
Figure 6. Targeted proteomics by automated quantification proteomics approach further characterised ATA+(a) and ATA+(b) group (validation cohort). (A) Heatmap represents selected proteins expression among groups. (B) Boxplots represent detailed overexpressed proteins in ATA+(a) group both vs ATA+(b) and HC (B). NS: non-significant (p value>0.05); *p value<0.05; **p value<0.01; ***p value<0.001; ***p value<0.0001. ATA+, anti-topoisomerase-I positive patients (N=24); ATA+(a), ATA+group a (N=11); ATA+(b), ATA+group b (N=13); ACA+, anti-centromere positive patients (N=18); ARA+, anti-RNA polymerase-III positive patients (N=5); ATA+, anti-topoisomerase-I positive patients; ATA+(a), anti-topoisomerase-I positive patients group a; ATA+(b), anti-topoisomerase-I positive patients group b; CDH2, cadherin 2; CDH5, VE-cadherin; CISD1, CDGSH iron sulphur domain 1; EIF2B3, eukaryotic translation initiation factor 2B subunit gamma; EPS15, epidermal growth factor receptor pathway substrate 15; FKBP11, FKBP prolyl isomerase 11; HC, healthy controls (N=20); ICAM-1, intercellular adhesion molecule 1; ITGA3, integrin alpha-3; NRBP1, nuclear receptor-binding protein; P4HA2, prolyl 4-hydroxylase subunit alpha-2; PNN, desmosome associated protein; RAE1, Rae1 RNA export 1; SEL1L, adaptor subunit of SYVN1 ubiquitin ligase; SNRPA, small nuclear ribonucleoprotein polypeptide A; STAM, signal transducing adaptor molecule; STK24, serine/threonine-protein kinase 24; TPP1, tripeptidyl-peptidase 1; TTN, titin.

References

    1. Denton CP, Khanna D. Systemic sclerosis. The Lancet. 2017;390:1685–99. doi: 10.1016/S0140-6736(17)30933-9. - DOI - PubMed
    1. Chepy A, Bourel L, Koether V, et al. Can Antinuclear Antibodies Have a Pathogenic Role in Systemic Sclerosis? Front Immunol. 2022;13:930970. doi: 10.3389/fimmu.2022.930970. - DOI - PMC - PubMed
    1. Günther J, Rademacher J, van Laar JM, et al. Functional autoantibodies in systemic sclerosis. Semin Immunopathol. 2015;37:529–42. doi: 10.1007/s00281-015-0513-5. - DOI - PubMed
    1. van den Hoogen F, Khanna D, Fransen J, et al. Classification Criteria for Systemic Sclerosis: An ACR-EULAR Collaborative Initiative. Arthritis Rheum. 2013;65:2737–47. doi: 10.1002/art.38098. - DOI - PMC - PubMed
    1. Chepy A, Vivier S, Bray F, et al. Effects of Immunoglobulins G From Systemic Sclerosis Patients in Normal Dermal Fibroblasts: A Multi-Omics Study. Front Immunol. 2022;13:904631. doi: 10.3389/fimmu.2022.904631. - DOI - PMC - PubMed