. 2025 Mar 24;25(1):533.
doi: 10.1186/s12885-025-13881-y.

Single-cell sequencing combined with urinary multi-omics analysis reveals that the non-invasive biomarker PRDX5 regulates bladder cancer progression through ferroptosis signaling

Affiliations

Single-cell sequencing combined with urinary multi-omics analysis reveals that the non-invasive biomarker PRDX5 regulates bladder cancer progression through ferroptosis signaling

Shun Wan et al. BMC Cancer. .

Abstract

Objective: This study aimed to elucidate the expression profile and biological implications of peroxidase 5 (PRDX5) in bladder cancer (BC), specifically investigating its influence on BC progression through modulation of reactive oxygen species (ROS) levels and activation of ferroptosis pathways.

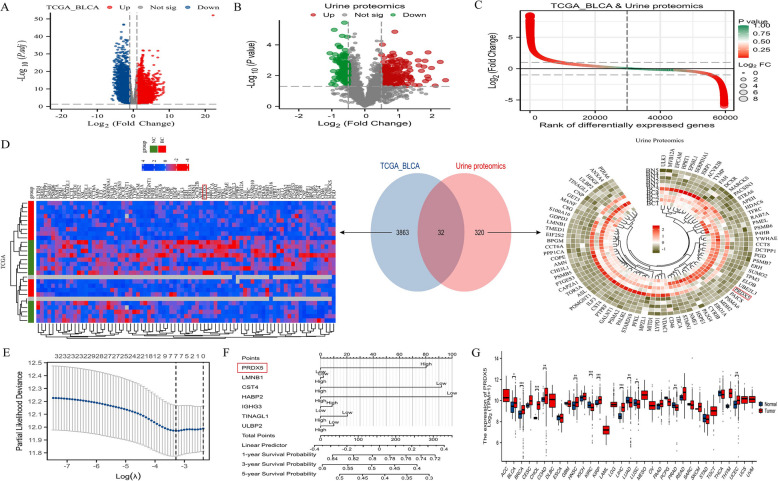
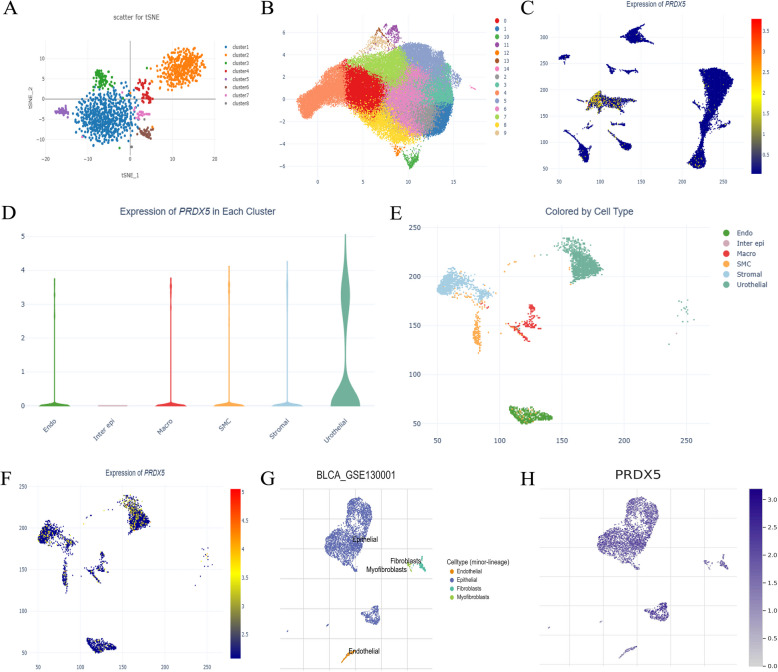
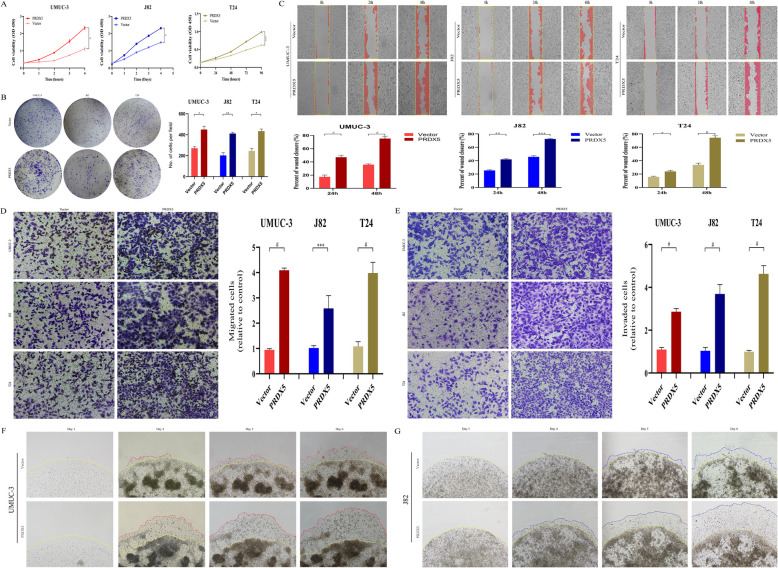
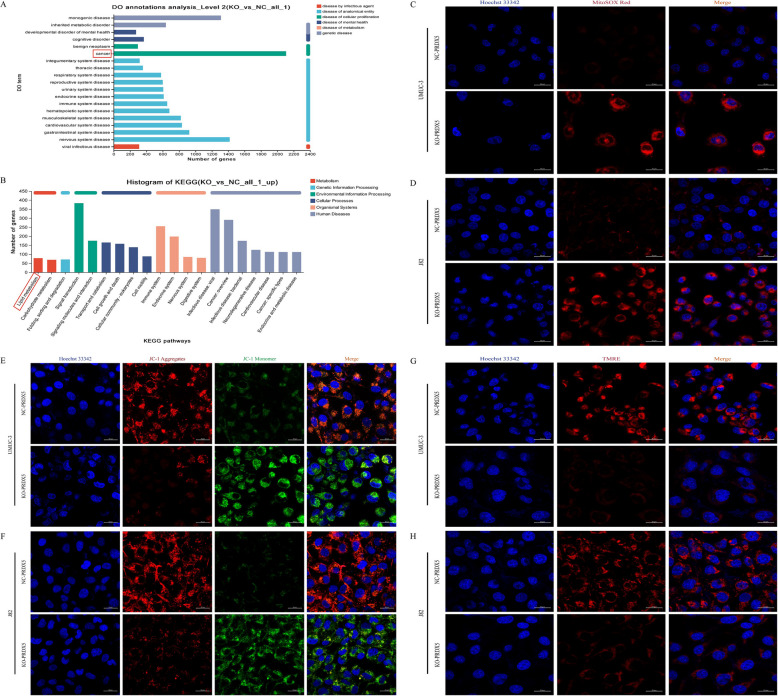
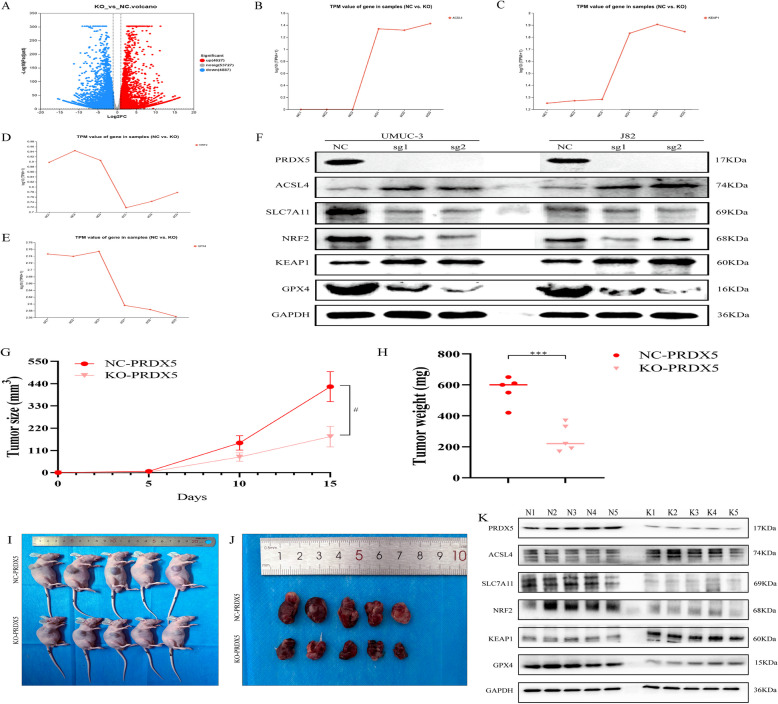
Methods: We employed urine proteomics data and transcriptomic information from the Cancer Genome Atlas (TCGA) to identify differentially expressed genes in BC tissues, focusing on PRDX5. Using single-cell RNA sequencing (scRNA-seq), we assessed PRDX5 distribution across various cell types in the tumor microenvironment. We conducted in vitro experiments to analyze the impact of PRDX5 on BC cell proliferation, migration, and invasion, while exploring its mechanisms of modulating ROS levels and ferroptosis. In vivo experiments were performed to observe PRDX5's influence on ferroptosis signaling in tissue contexts.

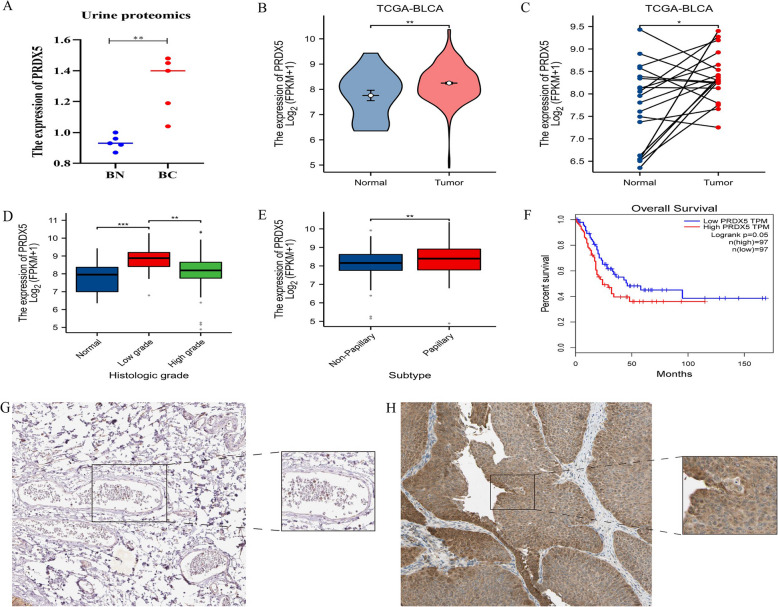
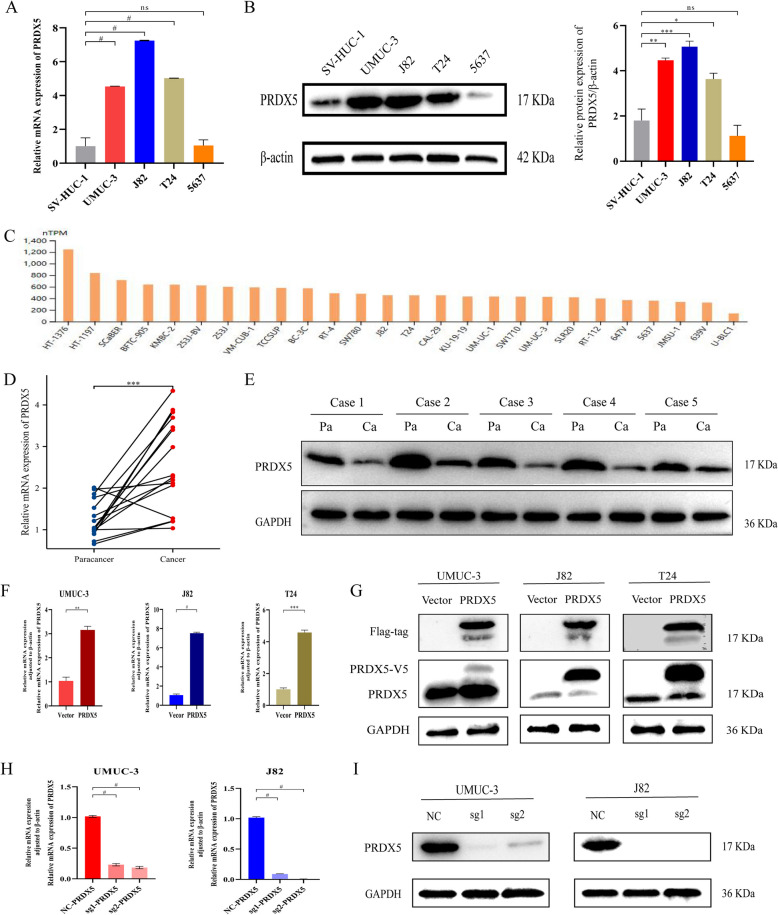
Results: We found significant upregulation of PRDX5 in BC tissues, with scRNA-seq revealing its enrichment in bladder epithelial cells, correlating with disease advancement and established BC markers. In vitro analyses showed that overexpressed PRDX5 enhanced proliferation, migration, and invasion of BC cells, while PRDX5 knockout produced opposing effects. Additionally, PRDX5 modulated ROS levels and impacted ferroptosis pathways. In vivo experiments confirmed that PRDX5 knockout inhibited tumor growth and activated ferroptosis signaling pathways in tissues.

Conclusion: Our study highlights the elevated expression of PRDX5 in BC and its role in promoting tumor progression through regulation of ROS levels and ferroptosis. PRDX5 may serve as a promising target for BC treatment, supporting further exploration of its potential in clinical applications.

Keywords: Bladder cancer; Ferroptosis; Multi-omics; PRDX5; Progression; Single cell; Urine.


Conflict of interest statement

Declarations. Ethics approval and consent to participate: Our study adhered to the Declaration of Helsinki and ethical guidelines established by the Institutional Medical Ethics Committee of Lanzhou University Second Hospital. All clinical samples were collected with informed consent from the patients and the collection was approved by the Medical Ethics Committee of the Lanzhou University Second Hospital (D2024-774). Consent for publication: Not applicable. Competing Interest: The authors declare no competing interests.

Figures

Fig. 1
Fig. 1
Selection of differential genes in BC through multi-omics integration. A Volcano plot of differentially expressed genes in the TCGA-BLCA gene expression profile; (B) Volcano plot of differentially expressed genes in the urinary proteomics gene expression profile; (C) Rank versus expression abundance curve for differentially expressed genes combining TCGA-BLCA and urinary proteomics data; (D) A Venn diagram illustrating the intersection of highly expressed differential genes from urine proteomics data and the TCGA-BLCA gene expression profile, along with their respective top-ranked differential genes; (E) Screening of Lasso regression coefficients for 32 hub genes; (F) 1-year, 3-year, and 5-year nomograms used to predict overall survival in BC; (G) Expression levels of PRDX5 across different cancer types
Fig. 2
Fig. 2
Differences in PRDX5 expression levels in BC and their correlation with clinical pathological features. A PRDX5 expression levels in urine proteomics from 5 BC patients and 5 normal individuals; (B) Comparison of PRDX5 expression levels between BC and normal tissues; (C) Paired comparison of PRDX5 expression levels between BC and normal tissues; (D) Comparison of PRDX5 expression levels among different histological grades; (E) Comparison of PRDX5 expression levels among different subtypes; (F) Relationship between PRDX5 expression levels and overall survival of BC patients; (G) Immunohistochemical staining of PRDX5 in adjacent non-cancerous tissues; (H) Immunohistochemical staining of PRDX5 in BC tissues
Fig. 3
Fig. 3
ScRNA-seq analysis of cell type distribution in the bladder tumor microenvironment and its relationship with PRDX5 expression. A t-SNE plot showing the distribution of different cell types in the bladder tumor microenvironment; (B) UMAP plot illustrating the distribution of various cell types in the bladder tumor microenvironment; (C) PRDX5 expression levels among different cell types within the bladder tumor microenvironment; (D) PRDX5 expression levels across different cell clusters in the bladder tumor microenvironment; (E) Dimensionality reduction analysis of different cell types in the bladder tumor microenvironment; (F) Cluster analysis of PRDX5 expression levels among various cell types in the BC microenvironment; (G) Cluster analysis of different cell types in the bladder tumor microenvironment from the single-cell dataset GSE130001; (H) PRDX5 expression levels in different cell types within the bladder tumor microenvironment from the single-cell dataset GSE130001
Fig. 4
Fig. 4
Analysis of scRNA-seq data in BC tissues. A Eight clusters were annotated based on cell type-specific marker genes following scRNA-seq of BC samples; (B) Cells were classified into five main types based on transcriptomic characteristics: endothelial cells, epithelial cells, fibroblasts, macrophages, and plasma cells; (C) Differences in PRDX5 expression between single cells from normal tissues and tumor tissues; (D) Expression levels of PRDX5 in various cell types, with notably higher expression in bladder epithelial cells; (E) Relationship between tumor T staging and PRDX5 expression in single-cell BC tissues; (F) Positive correlation of PRDX5 with common epithelial malignancy-related genes in BC, such as GATA3, KRT7, S100P, TP63, and UPK2
Fig. 5
Fig. 5
Expression of PRDX5 in BC cell lines and clinical patients. A mRNA expression levels of PRDX5 in normal bladder epithelial cell line SV-HUC-1 and BC cell lines UMUC-3, J82, T24, and 5637; (B) Protein expression levels of PRDX5 in normal bladder epithelial cell line SV-HUC-1 and BC cell lines UMUC-3, J82, T24, and 5637; (C) mRNA expression profile of PRDX5 in BC cell lines; (D) mRNA expression levels of PRDX5 in BC tissues and adjacent non-cancerous tissues; (E) Protein expression levels of PRDX5 in BC tissues and adjacent non-cancerous tissues; (F) mRNA expression levels following PRDX5 overexpression in BC cell lines; (G) Protein expression levels following PRDX5 overexpression in BC cell lines; (H) mRNA expression level assessment of KO-PRDX5 efficiency in BC cell lines; (I) Protein expression level assessment of KO-PRDX5 efficiency in BC cell lines. Pa, adjacent non-cancerous tissue; Ca, BC tissue; ns, not significant; *, p < 0.05; **, p < 0.01; ***, p < 0.001; #, p < 0.0001
Fig. 6
Fig. 6
Effects of PRDX5 overexpression in BC cell lines (UMUC-3, J82, and T24). A Comparison of cell proliferation ability over time in BC cell lines overexpressing PRDX5; (B) Cloning formation assays demonstrating enhanced growth and proliferative capacity in BC cell lines with PRDX5 overexpression; (C) Scratch migration assays indicating increased migration ability in cell lines overexpressing PRDX5; (D) Transwell migration assays showing enhanced migration capability in cell lines with PRDX5 overexpression; (E) Transwell invasion assays revealing increased invasive ability in cell lines with PRDX5 overexpression; (F) Enhanced invasive capability in 3D spheroid models of PRDX5-overexpressing UMUC-3; (G) Enhanced invasive capability in 3D spheroid models of PRDX5-overexpressing J82
Fig. 7
Fig. 7
Effects of KO-PRDX5 in BC cell lines (UMUC-3 and J82). A Comparison of cell proliferation ability over time in BC cell lines with KO-PRDX5; (B) Cloning formation assays indicating reduced growth and proliferative capacity in BC cell lines with KO-PRDX5; (C) Scratch migration assays demonstrating decreased migration ability in cell lines with KO-PRDX5; (D) Transwell migration assays showing reduced migration capability in cell lines with KO-PRDX5; (E) Transwell invasion assays revealing decreased invasive ability in cell lines with KO-PRDX5; (F) Reduced invasive capability in 3D spheroid models of KO-PRDX5 UMUC-3; (G) Reduced invasive capability in 3D spheroid models of KO-PRDX5 J82
Fig. 8
Fig. 8
Impact of PRDX5 expression levels on apoptosis, gene expression, and ROS levels in BC cell lines. A Comparison of apoptosis rates between PRDX5 overexpressing cell lines and control groups; (B) Comparison of apoptosis rates between KO-PRDX5 cell lines and control groups; (C) Differences in the expression of classic apoptosis pathway genes between PRDX5 overexpressing and control groups in UMUC-3; (D) Differences in the expression of classic apoptosis pathway genes between PRDX5 overexpressing and control groups in J82; (E) Differences in the expression of classic apoptosis pathway genes between KO-PRDX5 and control groups in UMUC-3; (F) Differences in the expression of classic apoptosis pathway genes between KO-PRDX5 and control groups in J82; (G) Comparison of ROS fluorescence levels between PRDX5 overexpressing cell lines and control groups; (H) Comparison of ROS fluorescence levels between KO-PRDX5 cell lines and control groups; (I) Flow cytometry analysis comparing ROS levels between KO-PRDX5 cell lines and control groups
Fig. 9
Fig. 9
Impact of KO-PRDX5 on gene expression profiles and mitochondrial function in BC cell lines. A Disease-related functional enrichment analysis of differentially expressed genes between KO-PRDX5 cell lines and control groups; (B) KEGG pathway enrichment analysis of differentially expressed genes between KO-PRDX5 cell lines and control groups; (C) Comparison of mitochondrial superoxide (MitoSOX) levels between KO-PRDX5 and control groups in the UMUC-3 cell line; (D) Comparison of mitochondrial superoxide (MitoSOX) levels between KO-PRDX5 and control groups in the J82 cell line; (E) Comparison of mitochondrial membrane potential between KO-PRDX5 and control groups in the UMUC-3 cell line; (F) Comparison of mitochondrial membrane potential between KO-PRDX5 and control groups in the J82 cell line; (G) Mitochondrial fluorescent probe (TMRE) staining showing KO-PRDX5 and control groups in UMUC-3 cells; (H) Mitochondrial fluorescent probe (TMRE) staining showing KO-PRDX5 and control groups in J82 cells
Fig. 10
Fig. 10
The function of PRDX5 in BC progression. A Volcano plot showing differential gene expression between the NC group and the KO-PRDX5 group; (B) Distribution of relative expression TPM values for ACSL4 in the NC group versus the KO-PRDX5 group; (C) Distribution of relative expression TPM values for KEAP1 in the NC group versus the KO-PRDX5 group; (D) Distribution of relative expression TPM values for NRF2 in the NC group versus the KO-PRDX5 group; (E) Distribution of relative expression TPM values for GPX4 in the NC group versus the KO-PRDX5 group; (F) Changes in the levels of ferroptosis marker proteins due to PRDX5 knock-out in cell lines; (G) Curve graph illustrating changes in tumor volume over time, highlighting differences in tumor growth rates between the NC-PRDX5 and KO-PRDX5 groups; (H) Comparison of tumor weights, demonstrating differences between the NC-PRDX5 and KO-PRDX5 groups; (I) Appearance of tumors between the NC-PRDX5 and KO-PRDX5 groups; (J) Size comparison of tumors between the NC-PRDX5 and KO-PRDX5 groups; (K) Changes in the levels of ferroptosis marker proteins due to PRDX5 knock-out in tumor tissues from nude mice

Similar articles

References

    1. Siegel RL, Giaquinto AN, Jemal A. Cancer statistics, 2024. CA Cancer J Clin. 2024;74(1):12–49. - PubMed
    1. Eissa S, Swellam M, el-Mosallamy H, Mourad MS, Hamdy NΜ, Kamel K, et al. Diagnostic value of urinary molecular markers in bladder cancer. Anticancer Res. 2003;23(5b):4347–55. - PubMed
    1. Sung H, Ferlay J, Siegel RL, Laversanne M, Soerjomataram I, Jemal A, et al. Global cancer statistics 2020: GLOBOCAN estimates of incidence and mortality worldwide for 36 cancers in 185 countries. CA Cancer J Clin. 2021;71(3):209–49. - PubMed
    1. Sun J-X, Xia Q-D, Zhong X-Y, Liu Z, Wang S-G. The bladder microbiome of NMIBC and MIBC patients revealed by 2bRAD-M. Front Cell Infect Microbiol. 2023;13: 1182322. - PMC - PubMed
    1. Pakmanesh H, Khajehsalimi A, Hesamarefi M, Ebadzadeh MR, Bazrafshan A, Malekpourafshar R, et al. Comparison of the overall survival of different treatment methods in patients with muscle-invasive bladder cancer: a retrospective study. Urologia. 2024;91(4):687–94. - PubMed

MeSH terms

LinkOut - more resources