. 2025 Mar 23;13(1):65.
doi: 10.1186/s40478-025-01958-5.

Proximity proteomics reveals unique and shared pathological features between multiple system atrophy and Parkinson's disease

Affiliations

Proximity proteomics reveals unique and shared pathological features between multiple system atrophy and Parkinson's disease

Solji G Choi et al. Acta Neuropathol Commun. .

Abstract

Synucleinopathies such as Parkinson's disease (PD), dementia with Lewy bodies (DLB), and multiple system atrophy (MSA) are neurodegenerative diseases with shared clinical and pathological features. Aggregates of alpha-synuclein (αsyn) phosphorylated at serine 129 (PSER129) are hallmarks of synucleinopathies, which, for PD/DLB, are found predominantly in neurons, whereas in MSA, aggregates are primarily found in oligodendroglia. It remains unclear whether the distinct pathological presentations of PD/DLB and MSA are manifestations of unique or shared pathological processes. Using the in-situ proximity labeling technique of biotinylation by antibody recognition (BAR), we compared aggregated αsyn-interactomes (BAR-PSER129) and total αsyn-interactomes (BAR-MJFR1) between MSA (n = 5) and PD/DLB (n = 10) in forebrain and midbrain structures. Comparison between MSA and PD/DLB-enriched proteins revealed 79 PD/DLB-differentially abundant proteins and only three MSA-differentially abundant proteins (CBR1, CRYAB, and GFAP). Pathway enrichment analysis revealed that vesicle/SNARE-associated pathways dominated PD/DLB interactions, whereas MSA was strongly enriched for metabolic/catabolic, iron, and cellular oxidant detoxification pathways. A subnetwork of cytosolic antioxidant enzymes called peroxiredoxins drove cellular detoxification pathway enrichment in MSA. A network of 26 proteins, including neuronal-specific proteins (e.g., SYNGR3) with HSPA8 at the core, was shared between MSA and DLB/PD. Extracellular exosome pathways were universally enriched regardless of the disease or BAR target protein. In conclusion, synucleinopathies have divergent and convergent αsyn-aggregate interactions, indicating unique and shared pathogenic mechanisms. MSA uniquely involves oxidant detoxification processes in glial cells, while vesicular processes in neurons dominate PD/DLB. Shared interactions, specifically SYNGR3, between MSA and PD/DLB suggest that neuronal axons are the origin of both diseases. In conclusion, we provide αsyn protein interaction maps for two distinct synucleinopathies.

Keywords: Antioxidant; Neurodegeneration; Proximity proteomics; SNARE complex; Spatial omics.


Conflict of interest statement

Declarations. Ethics approval and consent to participate: Brain specimens were provided by the Rush Movement Disorders Brain Bank, which collects high quality brain specimens with Rush University institutional review board approval. Consent for publication: Not applicable. Competing interests: The authors declare no competing interests.

Figures

Fig. 1
Fig. 1
Summary of approach. A Depiction of specimen sampling for studies. Longitudinal image of the right hemisphere of the human brain with the approximate location of sampling sites shown (black lines). For BAR, a single coronal section through the Caudate Nucleus and Putamen (Forebrain) and a single transverse section through the midbrain were pooled and used. B Depiction of studies. The distribution of αsyn aggregates is distinct between the synucleinopathies PD/DLB and MSA. For PD/DLB, αsyn aggregates are observed prominently in neuronal cell bodies and projections, termed neuronal inclusions (NI). In contrast, in the MSA brain, αsyn aggregates occur prominently in glia, termed glial inclusions (GI). Biotinylation by antibody recognition (BAR) was used to identify and compare interactomes of total αsyn (BAR-MJFR1) and aggregated αsyn (BAR-PSER129) directly in the PD/DLB and MSA brain. MJFR1 antibody maps to an epitope of a.a. 118–123 of αsyn’s c-terminus and captures physiological monomeric forms and aggregates. PSER129 preferentially labels αsyn aggregates, especially in the postmortem brain where physiological PSER129 is scarce [8], and thus, BAR-PSER129 will capture aggregate interactions. LC–MS/MS identified BAR-labeled proteins and differential abundance analysis was used to determine interactors (i.e., proteins enriched over BAR-NEG) and disease-enriched proteins (PD/DLB vs. MSA). The resulting proteins were analyzed using a combination of approaches: overlap analysis, pathway enrichment mapping, and protein interaction network mapping. IHC staining for C PSER129 and D αsyn (i.e., MJFR1) in forebrain and midbrain sections. Sections were stained using nickel-DAB chromogen (black) and counterstained with methyl green (green). Whole-section scans and high-magnification images of select pathology-bearing regions are shown with red and blue boxes denoting the approximate area of the high-magnification image. Signal thresholding was applied to 20X images of PSER129-stained tissues, specifically in gray matter (GM, red box) and white matter (WM, blue box) in the forebrain and midbrain for quantification. Enlarged 20X images showing the application of thresholding E and the subsequent quantification of PSER129 immunoreactivity across all cases F. Scale bars: C, D = 2 mm and 25 µm; E = 2 mm and 20 µm. MSA, n = 5; PD/DLB, n = 10.(mean ±SEM  *Tukey’s multiple comparisons test p-adj. < 0.05)
Fig. 2
Fig. 2
BAR capture in the PD/DLB and MSA brain. A 10 μg tissue lysate protein for each case were separated on 4–12% Bis–Tris gel transferred onto PVDF and stained for total protein (Revert Total Protein Stain, LI-Cor), PSER129, or αsyn. Chemiluminescence was used to detect PSER129 and αsyn. B PSER129 and αsyn relative density values were first normalized to total protein (i.e., loading control) and then normalized to the mean intensity for each group. C Spot blots of 1 µl eluent from BAR captures, including BAR-NEG (Primary antibody-omission control, “-”), BAR-PSER129 (aggregates “P”), and BAR-MJFR1 (total αsyn “M”) for each synucleinopathy case. Blots were probed for either biotin (ABC reagent) or αsyn (BDSYN1). D BAR enrichment was calculated by dividing for “P” and “M” by the relative density value for “-” (i.e., fold-enrichment over background) (mean ± SEM, Sidak's multiple comparison,**p-adj. < 0.005, n = 5–10)
Fig. 3
Fig. 3
PSER129 and αsyn proximal proteins in the synucleinopathy brain. BAR-labeled proteins were identified by LC–MS/MS and quantified using two approaches Maxquant/andromeda label free quantification (LFQ) and Scaffold/mascot total normalized spectra values (TNS). Volcano plots comparing protein abundance (i.e., LFQ value) between capture (BAR-MJFR1 and BAR-PSER129) and assay background (BAR-NEG) for A MSA and B PD/DLB. αsyn (i.e., BAR target protein) is denoted as a star. All significant differentially abundant proteins appear red. LFQ results shown, TNS results can be found in Additional file. Names of select high abundance proteins are annotated. C BAR-PSER129 differentially abundant proteins between MSA and PD/DLB brain. Proteins previously found to be significantly enriched in background A, B were excluded for MSA with PD/DLB comparison. Both LFQ and TNS results are shown. D Venn diagram showing BAR enriched proteins (i.e., significant over BAR-NEG) for each BAR condition and disease state. Proteins from both analysis (LFQ and TNS) were included. E Principal component analysis (PCA) plot of the top 100 variable proteins (Additional file 1: See Figure S9 for TNS PCA plot). F Heatmap with non-biased hierarchical clustering of protein abundance across all samples. LFQ shown, for TNS see Additional file 1: Figure S7 G Correlation heatmap comparing protein abundances between all samples. LFQ shown, for TNS see Additional file 1: Figure S8. PD/DLB, n = 10. MSA, n = 5. MJFR1 from BAR-NEG in both MSA and PD/DLB brains, with close grouping observed within each disease state (Fig. 3E). Similar to BAR-NEG, BAR-PSER129 in MSA brain was more related to PC2 than PC1
Fig. 4
Fig. 4
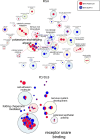
Pathway enrichment map for BAR-identified proteins. BAR-identified proteins from PD/DLB and MSA brains were analyzed by gProfiler, and significant (q > 0.05) GO Driver Terms were mapped using Enrichmentmap and annotated with Autoannotate. GO Driver terms were used to reduce redundancy and simplify enrichment maps. Nodes are color-coded according to BAR capture condition, BAR-PSER129 (Red) or BAR-MJFR1 (Blue). Node size is proportional to the number of protein set size and edges denote pathway overlap size. The top-panel is MSA enrichment map, and bottom-panel is PD/DLB enrichment map
Fig. 5
Fig. 5
Protein interaction networks identified in PD and MSA brain. BAR identified proteins were analyzed with STRING to plot known functional interactions for each proximal proteome. Proteins were grouped according to whether they were unique to PD/DLB, MSA, or shared between synucleinopathies. STRING networks for A BAR-PSER129 and B BAR-MJFR1 are shown. CentiScaPe 2.2 was used to determine the central “driver” node for each STRING network (i.e., highest “betweenness” score). The driver node was enlarged, and the first neighbors in network highlighted. For, BAR-PSER129 C and BAR-MJFR1 D MCL clustering was used to group nodes. Clusters with 6 nodes or more are depicted. Top enrichment (GOCC, GOMF, GOBP) are annotated onto each cluster. E Physical interaction network of proteins specific to MSA for all differential expression analysis. BAR target SNCA was included in the network. Nodes annotated with top enriched pathway and disconnected nodes not shown

Update of

References

    1. Artan M, Hartl M, Chen W, de Bono M (2022) Depletion of endogenously biotinylated carboxylases enhances the sensitivity of turboID-mediated proximity labeling in caenorhabditis elegans. J Biol Chem 298:102343. 10.1016/j.jbc.2022.102343 - PMC - PubMed
    1. Asi YT, Simpson JE, Heath PR, Wharton SB, Lees AJ, Revesz T, Houlden H, Holton JL (2014) Alpha-synuclein mRNA expression in oligodendrocytes in MSA. Glia 62:964–970. 10.1002/glia.22653 - PMC - PubMed
    1. Barca E, Kleiner G, Tang G, Ziosi M, Tadesse S, Masliah E, Louis ED, Faust P, Kang UJ, Torres J et al (2016) Decreased coenzyme Q10 levels in multiple system atrophy cerebellum. J Neuropathol Exp Neurol 75:663–672. 10.1093/jnen/nlw037 - PMC - PubMed
    1. Bjornsdottir A, Gudmundsson G, Blondal H, Olafsson E (2013) Incidence and prevalence of multiple system atrophy: a nationwide study in Iceland. J Neurol Neurosurg Psychiatry 84:136–140. 10.1136/jnnp-2012-302500 - PubMed
    1. Borghi R, Marchese R, Negro A, Marinelli L, Forloni G, Zaccheo D, Abbruzzese G, Tabaton M (2000) Full length alpha-synuclein is present in cerebrospinal fluid from Parkinson’s disease and normal subjects. Neurosci Lett 287:65–67. 10.1016/s0304-3940(00)01153-8 - PubMed

Publication types

Substances