. 2025 Mar 23;16(1):2849.
doi: 10.1038/s41467-025-57234-6.

Evidence of isospin-symmetry violation in high-energy collisions of atomic nuclei

Collaborators, Affiliations

Evidence of isospin-symmetry violation in high-energy collisions of atomic nuclei

NA61/SHINE Collaboration et al. Nat Commun. .

Abstract

Strong interactions preserve an approximate isospin symmetry between up (u) and down (d) quarks, part of the more general flavor symmetry. In the case of K meson production, if this isospin symmetry were exact, it would result in equal numbers of charged (K+ and K-) and neutral (K0 and K ¯ 0 ) mesons produced in collisions of isospin-symmetric atomic nuclei. Here, we report results on the relative abundance of charged over neutral K meson production in argon and scandium nuclei collisions at a center-of-mass energy of 11.9 GeV per nucleon pair. We find that the production of K+ and K- mesons at mid-rapidity is (18.4 ± 6.1)% higher than that of the neutral K mesons. Although with large uncertainties, earlier data on nucleus-nucleus collisions in the collision center-of-mass energy range 2.6 < s N N < 200 GeV are consistent with the present result. Using well-established models for hadron production, we demonstrate that known isospin-symmetry breaking effects and the initial nuclei containing more neutrons than protons lead only to a small (few percent) deviation of the charged-to-neutral kaon ratio from unity at high energies. Thus, they cannot explain the measurements. The significance of the flavor-symmetry violation beyond the known effects is 4.7σ when the compilation of world data with uncertainties quoted by the experiments is used. New systematic, high-precision measurements and theoretical efforts are needed to establish the origin of the observed large isospin-symmetry breaking.


Conflict of interest statement

Competing interests: The authors declare no competing interests.

Figures

Fig. 1
Fig. 1. Comparison of rapidity spectrum of neutral (KS0) with the averaged spectrum of charged (K+ and K) mesons in the 10% most central Ar+Sc collisions at sNN=11.9 GeV.
Total uncertainties, calculated as the square root of the sum of squared statistical and systematic uncertainties (σstat2+σsys2) are drawn. For charged K mesons, the total uncertainties were calculated separately for positively and negatively charged and then propagated.
Fig. 2
Fig. 2. Comparison of transverse momentum spectrum of neutral (KS0) with the averaged spectrum of charged (K+ and K) mesons in the 10% most central Ar+Sc collisions at sNN=11.9 GeV.
The bottom panel shows the ratio of the two distributions, as defined in Eq. (2). The meaning of the total uncertainties drawn is the same as in Fig. 1.
Fig. 3
Fig. 3. The charged-to-neutral kaon ratio RK as a function of collision energy.
The symbols show the experimental world data with total uncertainties; see Methods' “World data” subsection for details. The black line shows the HRG predictions for Q/B = 0.4. The black dots indicate the HRG predictions for Q/B values corresponding to the ones in the experiments. For different nuclei, Q/B corresponds to the electric charge over the baryon number of the whole system. The gray squares show UrQMD predictions. See Methods' “Models” subsection for details on models.
Fig. 4
Fig. 4. The experimental data for the charged-to-neutral kaon ratio divided by the HRG baseline RK/RKHRG as a function of collision energy.
The symbols are explained in Fig. 3. The solid black line shows the weighted average of the experimental data, and the shaded area shows the uncertainty of the weighted average.
Fig. 5
Fig. 5. Examples of fitted invariant mass distributions.
Two studied bins in rapidity y and transverse momentum pT of the KS0 are presented, left: y ∈ ( −1.0, −0.5), pT ∈ (1.2, 1.5) GeV/c, right: y ∈ (0.5, 1.0), pT ∈ (1.2, 1.5) GeV/c. Only statistical uncertainties are presented. The bottom panels show the difference between the experimental data and the fitted (Signal+Background) distribution, divided by the experimental uncertainty.
Fig. 6
Fig. 6. Mean lifetime of KS0 mesons as a function of rapidity.
The values obtained by NA61/SHINE are divided by the PDG value. Statistical uncertainties are shown by vertical bars and systematic ones by shaded boxes.
Fig. 7
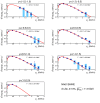
Fig. 7. KS0 transverse momentum spectra in rapidity bins.
Statistical uncertainties are shown by vertical bars and systematic ones by shaded boxes. Red curves represent fits of the data with the function defined in Eq. (4). The inverse slope parameters (T), with their statistical uncertainties resulting from the fits, are also displayed inside the panels.

References

    1. Fritzsch, H., Gell-Mann, M. & Leutwyler, H. Advantages of the color octet gluon picture. Phys. Lett. B47, 365–368 (1973).
    1. Heisenberg, W. On the structure of atomic nuclei. Z. Phys.77, 1–11 (1932).
    1. Navas, S. et al. Review of particle physics. Phys. Rev. D110, 030001 (2024).
    1. Kneur, J. L. & Neveu, A. formula image from renormalization group optimized perturbation. Phys. Rev. D85, 014005 (2012).
    1. Deur, A. & Brodsky, S. J. The QCD running coupling. Nucl. Phys.90, 1 (2016).

LinkOut - more resources