. 2025 Mar 23;12(1):484.
doi: 10.1038/s41597-025-04670-0.

Tactile, Audio, and Visual Dataset During Bare Finger Interaction with Textured Surfaces

Affiliations

Tactile, Audio, and Visual Dataset During Bare Finger Interaction with Textured Surfaces

Alexis W M Devillard et al. Sci Data. .

Abstract

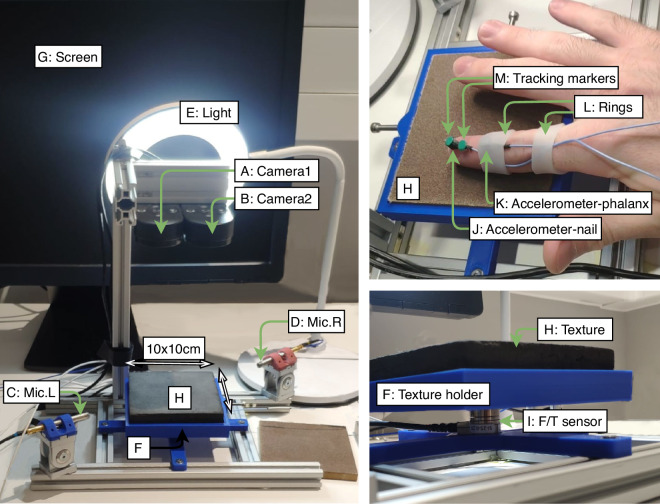
This paper presents a comprehensive multi-modal dataset capturing concurrent haptic, audio, and visual signals recorded from ten participants as they interacted with ten different textured surfaces using their bare fingers. The dataset includes stereoscopic images of the textures, and fingertip position, speed, applied load, emitted sound, and friction-induced vibrations, providing an unprecedented insight into the complex dynamics underlying human tactile perception. Our approach utilizes a human finger (while most previous studies relied on rigid sensorized probes), enabling the naturalistic acquisition of haptic data and addressing a significant gap in resources for studies of human tactile exploration, perceptual mechanisms, and artificial tactile perception. Additionally, fifteen participants completed a questionnaire to evaluate their subjective perception of the surfaces. Through carefully designed data collection protocols, encompassing both controlled and free exploration scenarios, this dataset offers a rich resource for studying human multi-sensory integration and supports the development of algorithms for texture recognition based on multi-modal inputs. A preliminary analysis demonstrates the dataset's potential, as classifiers trained on different combinations of data modalities show promising accuracy in surface identification, highlighting its value for advancing research in multi-sensory perception and the development of human-machine interfaces.


Conflict of interest statement

Competing interests: The authors declare no competing interests.

Figures

Fig. 1
Fig. 1
Experimental setup used to collect multi-modal data from human fingertip interactions with various textured surfaces. (A,B) 4K cameras 1 and 2 above a textured surface. (C,D) Directional microphones Left and Right with adjustable support. (E) Light source. (F) Texture holder. (G) Screen to display GUI. (H) Texture. (I) Force/torque sensor. (J) Accelerometer-nail glued to the nail, and (K) accelerometer phalanx strapped to the index finger by a (L) Silicone ring. (K) 2 Tracking markers for the fingertip motion and direction recording.
Fig. 2
Fig. 2
Representative textures used in the experiments, selected from the larger set of study.
Fig. 3
Fig. 3
Visualisation of some of the physical signals recorded during lateral sliding (phase 2.c of a trial). The figure shows the following signals from top to bottom: position, speed and velocity direction of the first marker; force measured below the center of the surface; vibration (acceleration) measured on the nail and phalanx; audio signal from the left microphone.
Fig. 4
Fig. 4
Graphical User Interface (GUI). The interface shows a filled circle (A) indicating fingertip position and an empty square (D) representing the texture’s boundaries. The user instructions are displayed on top of the GUI (C). Depending on the trial type, the GUI can display a moving target (B) and/or a load gauge (E).
Fig. 5
Fig. 5
Trials types and associated GUI. Each participant performed 50 trials, divided into three types: Standard, Constant Speed, and Constant Load. Each trial was further divided into five phases: unrestricted sliding, clockwise circular sliding, anti-clockwise circular sliding, lateral back-and-forth sliding, and proximal/distal back-and-forth sliding.
Fig. 6
Fig. 6
Psychophysical evaluation procedure. The evaluation was divided into two parts: Individual evaluation (Protocol 1 and GUI 1) and ranking evaluation (Protocol 2 and GUI 2). In the individual evaluation, participants were asked to rate the 12 features for each texture. In the ranking evaluation, participants ranked the textures for each feature.
Fig. 7
Fig. 7
Classification Performance Comparison on Main Phase Data between Uni-modal and Multi-modal Models with Random Forest Classifier. The standard deviations are listed in Table 5.
Fig. 8
Fig. 8
Distribution of the scores for each texture in the questionnaire.
Fig. 9
Fig. 9
Principal Component Analysis of the normalized rankings of the textures. (a) Scatter plot of the textures in the reduced two-dimensional space defined by the first two principal components. To provide insight into the variability of the subjective evaluations within each texture, the mean and standard deviation of the samples in each texture group are visualized as a star marker and a circle, respectively (b) Percentage of variance explained by the first seven principal components. (c) Weights and modality of each question in the first four principal components.

References

    1. Durrant-Whyte, H. F. Sensor models and multisensor integration. The International Journal of Robotics Research7, 97–113 (1988).
    1. Ernst, M. O. & Bülthoff, H. H. Merging the senses into a robust percept. Trends in Cognitive Sciences8, 162–169, 10.1016/j.tics.2004.02.002 (2004). - PubMed
    1. Bertelson, P. & De Gelder, B. The psychology of multimodal perception. Crossmodal Space and Crossmodal Attention 141–177 (2004).
    1. Munoz, N. E. & Blumstein, D. T. Multisensory perception in uncertain environments. Behavioral Ecology23, 457–462 (2012).
    1. Anderson, B. L. Stereoscopic surface perception. Neuron24, 919–928 (1999). - PubMed

LinkOut - more resources