. 2025 Mar;169(3):e70048.
doi: 10.1111/jnc.70048.

Hippocampal Inhibitory Interneuron-Specific DREADDs Treatment Alters mTORC1-4E-BP Signaling and Impairs Memory Formation

Affiliations

Hippocampal Inhibitory Interneuron-Specific DREADDs Treatment Alters mTORC1-4E-BP Signaling and Impairs Memory Formation

Ziying Huang et al. J Neurochem. 2025 Mar.

Abstract

Control of protein synthesis via the mechanistic target of rapamycin complex 1 (mTORC1) is essential for learning and memory. However, the cell-type-specific and spatiotemporal regulation of this pathway during memory formation is not well understood. In this study, we expressed artificial human muscarinic M3 [hM3D(Gq)] or M4 [hM4D(Gi)] designer receptors exclusively activated by designer drugs (DREADDs) in hippocampal CA1 excitatory or inhibitory neurons of adult mice. We studied the impact of clozapine-N-oxide (CNO), a synthetic DREADDs agonist, on the mTORC1 pathway and long-term memory. hM3D(Gq) and hM4D(Gi) activate or inactivate, respectively, mTORC1 signaling in hippocampal interneurons, as indicated by the phosphorylation of its targets, eukaryotic initiation factor 4E-binding proteins (4E-BP1/2) and ribosomal protein S6 (S6). Activation of either hM3D(Gq) or hM4D(Gi) in mice immediately after training in memory tasks impaired long-term memory formation in inhibitory, but not in excitatory neurons. The findings underscore the importance of activity-dependent mTORC1-4E-BP1/2 signaling in hippocampal inhibitory interneurons for memory formation.

Keywords: 4E‐BP; clozapine‐N‐oxide; hippocampus; interneurons; mTORC1; memory.


Conflict of interest statement

The authors declare no conflicts of interest.

Figures
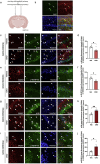
FIGURE 1
FIGURE 1
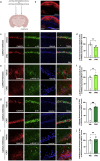
Hippocampal DREADDs expression and bidirectional manipulation of mTORC1 activity in Gad2‐Cre mice via hM4D(Gi) and hM3D(Gq). (a) Schematic of AAV injection into the CA1 hippocampus of Gad2‐Cre mice. (b) mCherry fluorescence in the CA1 hippocampus 3 weeks following injection. GAD67 (green) and mCherry (red) fluorescence overlap (yellow, merged image). Scale bar 50 μm. (c) Fluorescence analysis of p‐S6 (S240/244) (green) in the hippocampus Gad67+ neuron (red) in GAD2‐hM4D(Gi) + CNO (number of animals = 4) vs. GAD2‐hM4D(Gi) + saline (number of animals = 4). (d) Quantification (integrated density) of p‐S6 (240/244) from (c). (e) Fluorescence analysis of p‐4E‐BP1/2 (T37/46) (green) in the hippocampus Gad67+ neuron (red) in GAD2‐hM4D(Gi) + CNO (number of animals = 4) vs. GAD2‐hM4D(Gi) + saline (number of animals = 4). (f) Quantification (integrated density) of p‐4E‐BP1/2 (T37/46) from (e). (g) Fluorescence analysis of p‐S6 (240/244) (green) in the hippocampus Gad67+ neuron (red) in GAD2‐hM3D(Gq) + CNO (number of animals = 4) vs. GAD2‐hM3D(Gq) + saline (number of animals = 4). (h) Quantification (integrated density) of p‐S6 (240/244) from (g). (i) Fluorescence analysis of p‐4E‐BP1/2 (T37/46) (green) in the hippocampus Gad67+ neuron (red) in GAD2‐hM3D(Gq) + CNO (number of animals = 4) vs. GAD2‐hM3D(Gq) + saline (number of animals = 4). (j) Quantification (integrated density) of p‐4E‐BP1/2 (T37/46) from (i). Cell nuclei are stained with Hoechst (blue). White arrows indicate GABAergic (i.e., GAD67) inhibitory neurons. Scale bar represents 50 μm (c and g) and 20 μm (e and i). *p < 0.05, **p < 0.01, calculated with an unpaired t‐test. Data are presented as mean ± SEM.
FIGURE 2
FIGURE 2
Post‐training activation of hM4D(Gi) and hM3D(Gq) DREADDs in inhibitory neurons disrupts hippocampus‐dependent memory formation. (a) Schematic of the timeline and experimental design with Gad2‐Cre mice. Mice underwent stereotactic surgery where the DREADDs were infused bilaterally into the CA1 hippocampus. Following 3 weeks of recovery and viral expression, mice were habituated to the testing apparatus. On subsequent days, mice were subjected to a series of training immediately followed by an i.p. injection of saline or CNO. Mice were tested for memory ability on the final day according to the protocol. (b–d) Memory measured by discrimination index of object exploration and total exploratory behavior during testing in GAD2‐hM4D(Gi) + CNO (NOL number of animals =15; OPL number of animals = 15; NOR number of animals = 15) vs. GAD2‐hM4D(Gi) + saline (NOL number of animals = 15; OPL number of animals = 15; NOR number of animals = 15). (e–g) Memory measured by discrimination index of object exploration and total exploratory behavior during testing in GAD2‐hM3D(Gq) + CNO (NOL number of animals = 9; OPL number of animals = 9; NOR number of animals = 9) vs. GAD2‐hM3D(Gq) + saline (NOL number of animals = 9; OPL number of animals = 9; NOR number of animals = 9). *p < 0.05, **p < 0.01, ***p < 0.001, ns not significant, calculated by an unpaired t‐test. # p < 0.05, ## p < 0.01, ### p < 0.001, ns not significant, calculated by a one sample t‐test. Data are presented with box and whisker plots where “+” indicates the mean. Dashed line indicates no discrimination of objects (i.e., memory impairment).
FIGURE 3
FIGURE 3
Hippocampal DREADDs expression and bidirectional manipulation of mTORC1 activity in Camk2a‐Cre mice by hM4D(Gi) and hM3D(Gq). (a) Schematic of AAV injection into the CA1 hippocampus of Camk2a‐Cre mice. (b) mCherry fluorescence in the CA1 hippocampus 3 weeks following injection. Scale bar 200 μm. (c) Fluorescence analysis of p‐S6 (240/244) (green) in the hippocampus CaMK2A+ neurons (red) in CaMK2A‐hM4D(Gi) + CNO (number of animals = 4) vs. CaMK2A‐hM4D(Gi) + saline (number of animals = 4). (d) Quantification (integrated density) of p‐S6 (240/244) from (c). (e) Fluorescence analysis of p‐4E‐BP1/2 (T37/46) (green) in the hippocampus CaMK2A+ neurons (red) in CaMK2A‐hM4D(Gi) + CNO (number of animals = 4) vs. CaMK2A‐hM4D(Gi) + saline (number of animals = 4). (f) Quantification (integrated density) of p‐4E‐BP1/2 (T37/46) from (e). (g) Fluorescence analysis of p‐S6 (240/244) (green) in the hippocampus CaMK2A+ neurons (red) in CaMK2A‐hM3D(Gq) + CNO (number of animals = 5) vs. CaMK2A‐hM3D(Gq) + saline (number of animals = 5). (h) Quantification (integrated density) of p‐S6 (240/244) from (g). (i) Fluorescence analysis of p‐4E‐BP1/2 (T37/46) (green) in the hippocampus CaMK2A+ neurons (red) in CaMK2A‐hM3D(Gq) + CNO (number of animals = 4) vs. CaMK2A‐hM3D(Gq) + saline (number of animals = 4). (j) Quantification (integrated density) of p‐4E‐BP1/2 (T37/46) from (i). Cell nuclei are stained with Hoechst (blue). The pyramidal cell layer indicates CA1 excitatory (i.e., CaMK2A) neurons. Scale bar represents 50 μm (c and g) and 20 μm (e and i). *p < 0.05, **p < 0.01, calculated with an unpaired t‐test. Data are presented as mean ± SEM.
FIGURE 4
FIGURE 4
Post‐training activation of hM4D(Gi) and hM3D(Gq) DREADDs in excitatory neurons does not affect hippocampus‐dependent memory formation. (a) Schematic of the timeline and experimental design with Camk2‐Cre mice. (b–d) Memory measured by discrimination index of object exploration, and total exploratory behavior during testing in CaMK2A‐hM4D(Gi) + CNO (NOL number of animals = 9; OPL number of animals = 9; NOR number of animals = 9) vs. CaMK2A‐hM4D(Gi) + saline (NOL number of animals = 10; OPL number of animals = 10; NOR number of animals = 10). (e–g) Memory measured by discrimination index of object exploration, and total exploratory behavior during testing in CaMK2A‐hM3D(Gq) + CNO (NOL number of animals = 12; OPL number of animals = 12; NOR number of animals = 12) vs. CaMK2A‐hM3D(Gq) + saline (NOL number of animals = 10; OPL number of animals = 10; NOR number of animals = 10). ns not significant, calculated by an unpaired t‐test. ## p < 0.01, ### p < 0.001, calculated by a one sample t‐test. Data are presented with box and whisker plots where “+” indicates the mean. Dashed line indicates no discrimination of objects (i.e., memory impairment).

References

    1. Agranoff, B. W. , and Klinger P. D.. 1964. “Puromycin Effect on Memory Fixation in the Goldfish.” Science 146, no. 3646: 952–953. 10.1126/science.146.3646.952. - DOI - PubMed
    1. Aguilar‐Valles, A. , De Gregorio D., Matta‐Camacho E., et al. 2021. “Antidepressant Actions of Ketamine Engage Cell‐Specific Translation via eIF4E.” Nature 590, no. 7845: 315–319. 10.1038/s41586-020-03047-0. - DOI - PubMed
    1. Alapin, J. M. , Mohamed M. S., Shrestha P., et al. 2023. “Opto4E‐BP, an Optogenetic Tool for Inducible, Reversible, and Cell Type‐Specific Inhibition of Translation Initiation.” bioRxiv 10.1101/2023.08.30.554643. - DOI
    1. Alberini, C. M. , and Kandel E. R.. 2014. “The Regulation of Transcription in Memory Consolidation.” Cold Spring Harbor Perspectives in Biology 7, no. 1: a021741. 10.1101/cshperspect.a021741. - DOI - PMC - PubMed
    1. Alcacer, C. , Andreoli L., Sebastianutto I., Jakobsson J., Fieblinger T., and Cenci M. A.. 2017. “Chemogenetic Stimulation of Striatal Projection Neurons Modulates Responses to Parkinson's Disease Therapy.” Journal of Clinical Investigation 127, no. 2: 720–734. 10.1172/jci90132. - DOI - PMC - PubMed

MeSH terms