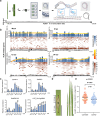
. 2025 May;12(19):e2416846.
doi: 10.1002/advs.202416846. Epub 2025 Mar 24.

Single-Cell and Spatial Transcriptomics Reveals a Stereoscopic Response of Rice Leaf Cells to Magnaporthe oryzae Infection

Affiliations

Single-Cell and Spatial Transcriptomics Reveals a Stereoscopic Response of Rice Leaf Cells to Magnaporthe oryzae Infection

Wei Wang et al. Adv Sci (Weinh). 2025 May.

Abstract

Infection by the fungal pathogen Magnaporthe oryzae elicits dynamic responses in rice. Utilizing an integrated approach of single-cell and spatial transcriptomics, a 3D response is uncovered within rice leaf cells to M. oryzae infection. A comprehensive rice leaf atlas is constructed from 236 708 single-cell transcriptomes, revealing heightened expression of immune receptors, namely Pattern Recognition Receptors (PRRs) and Nucleotide-binding site and leucine-rich repeat (NLRs) proteins, within vascular tissues. Diterpene phytoalexins biosynthesis genes are dramatically upregulated in procambium cells, leading to an accumulation of these phytoalexins within vascular bundles. Consistent with these findings, microscopic observations confirmed that M. oryzae is prone to target leaf veins for invasion, yet is unable to colonize further within vascular tissues. Following fungal infection, basal defenses are extensively activated in rice cells, as inferred from trajectory analyses. The spatial transcriptomics reveals that rice leaf tissues toward leaf tips display stronger immunity. Characterization of the polarity gene OsHKT9 suggests that potassium transport plays a critical role in resisting M. oryzae infection by expression along the longitudinal axis, where the immunity is stronger toward leaf tip. This work uncovers that there is a cell-specific and multi-dimensional (local and longitudinal) immune response to a fungal pathogen infection.

Keywords: Magnaporthe oryzae‐rice interaction; single‐cell transcriptomics; spatial transcriptomics; vascular immunity; longitudinal immunity.


Conflict of interest statement

The authors declare no conflict of interest.

Figures

Figure 1
Figure 1
Transcriptome atlas of rice leaf cells infected with M. oryzae. a) Micrographs of rice leaf sheath inoculated with M. oryzae. M. oryzae strain Guy11 expressing mCherry red fluorescence was used to observe the infection. Images were taken at 12, 24, 48, and 72 h post‐inoculation (hpi). Scale bars, 10 µm. b) Schematic diagram of the single nucleus transcriptomics library preparation, sequencing, and analysis. c) Dot plot of the mean expression levels and percent of cells expressing cell‐specific marker genes in different clusters in the integrated snRNA‐seq data. The data were integrated from all sequenced cells. The cell‐specific markers are from Wang et al.[ 16 ] d) A transcriptome atlas consisting of 236,708 cells. Each cell was represented by a dot on a plot visualized by uniform manifold approximation and projection (UMAP). According to Graph‐based unsupervised clustering, the cells were divided into 20 clusters using graph‐based, unsupervised clustering. The clusters were assigned to 9 cell types and the unknown cell types. e) The paraffin sectioning image of the cross dissection of rice leaf vein. A two‐week‐old rice leaf was used for the cross‐dissection. The cell‐specific tissues were indicated with letters. The tissues were stained with safranine, and the photo was taken using a light microscope. M, Mesophyll; X, Xylem; F, Fiber; Pr, Procambium; MS, Mestome sheath; E, Epidermis; GC, Guard cell; Ph, Phloem; LP, Large parenchyma; BC, Bulliform cell; GC, Guard cell. Scale bars, 20 µm.
Figure 2
Figure 2
Spatiotemporal cell‐type‐specific expression of immune‐related genes. a) The differentially expressed genes (DEGs) identified by snRNA‐seq and bulk RNA‐seq. The DEGs identified by snRNA‐seq were masked in bulk transcriptome assays. Rice leaves were inoculated with M. oryzae spores and sampled at indicated time points. The bulk RNA‐seq data were retrieved from NCBI (PRJNA661210). DEGs from the snRNA‐seq data were detected by FindMarker in each annotated cell type using cutoffs of | average log2FC| > 1.0, p adj < 0.01, pct.1 > 0.2 for up‐regulated genes and pct.2 > 0.2 for down‐regulated genes. DEGs calling from the bulk RNA‐seq used cutoffs of |log2FC| > 1 and p adj < 0.01. M, Mesophyll; X, Xylem; F, Fiber; Pr, Procambium; MS, Mestome sheath; E, Epidermis; GC, Guard cell; Ph, Phloem; LP, Large parenchyma. NS, not significant. b) Dot plot of the average log2FC and percent of cell expression. Upper panel: Known PRR genes were expressed across different cell populations in the integrated snRNA‐seq data at 12, 24, and 48 hpi. Lower panel: Dot plot of NLR DEGs based on average log2FC value comparing with their control. |average log2FC| > 1.0, p adj < 0.01, pct.1 > 0.01 for up‐regulated genes and pct.2 > 0.01 for down‐regulated genes. M, Mesophyll; X, Xylem; F, Fiber; Pr, Procambium; MS, Mestome sheath; E, Epidermis; GC, Guard cell; Ph, Phloem; LP, Large parenchyma. c) LOC_Os10g22510 mutant plants exhibited reduced disease resistance to M. oryzae. Disease symptoms were developed by spray inoculation with conidial suspensions at a concentration of 5 × 10⁵ spores mL−1. Images were taken at 5 dpi. d) The relative fungal biomass was determined by qPCR for the M. oryzae Pot2 gene against rice OsUbi gene. Values are means ± SD. “*” represents p < 0.05 (Student's t‐test, n = 3 biological replicates). e) LOC_Os08g29809 mutant plants exhibited reduced disease resistance to M. oryzae. Disease symptoms were developed by spray inoculation with conidial suspensions at a concentration of 5 × 10⁵ spores mL−1. Images were taken at 5 dpi. f) The relative fungal biomass was determined by qPCR for the M. oryzae Pot2 gene against rice OsUbi gene. Values are means ± SD. “*” represents p < 0.05 (Student's t‐test, n = 3 biological replicates). g) Cell‐type‐specific expression of metabolic genes during M. oryzae infection. Heatmaps show mean expression levels of metabolic genes from rice cells in each annotated cell type based on colored Z‐scores. Others are same as in b). h) Expression of momilactone biosynthesis genes. Upper panel: total gain value of key momilactone biosynthesis gene expression. Lower panel: dot plot of average log2FC in different cell types at 12, 24, and 48 hpi. Total gain value = average log2FC × pct.1. Pct.1 means the percentage of cells where the gene is detected in the treatment group. i) Measurement of momilactone A in different rice leaf tissues. The content of momilactone A in different rice leaf tissues was measured by LC‐MS/MS after inoculated with M. oryzae at 24, 48, and 72 hpi. Ot, other tissues; Vt, vascular tissues. Letters indicate the significant difference between the expression levels at different sites by one‐way ANOVA at p < 0.05 (n = 3 biological repeats). Error bars represent means ± SD.
Figure 3
Figure 3
Rice vascular tissue exhibits a strong immune response to M. oryzae infection. a) Representative confocal micrographs show that M. oryzae targets rice leaf veins. The mCherry‐labeled M. oryzae strain Guy11 primarily targeted rice leaf veins. The rice cell plasma membrane was labeled with PIP2‐GFP to visualize cell profiles. The rice leaves were spray‐inoculated with M. oryzae spores at a concentration of 5 × 10⁵ spores mL−1. The infection process was observed with a confocal microscope at indicated time points. V, vein; S, spore; AP, appressorium; IH, invasive hyphae. Scale bars, 20 µm. b) Relative fungal biomass in vein and the rest of the tissues following the infection process. The fungal biomass was determined by qPCR of MoPot2 gene against OsUbi1 gene in M. oryzae and rice, respectively. The experiment was repeated three times with similar results. Each experiment used five infected rice leaves. The leaf tissues were separated as “vein tissue” and “other tissue”. ** represents the significance between the two samples by Student's t‐test at p < 0.01 and p < 0.0001(****), n = 5 leaves. c) Confocal microscopic observation of the distribution of M. oryzae hyphae in rice leaves. The infective hyphae were observed at lesion edge of rice leaf at 4 dpi. The mCherry‐labeled Guy11 spores were used to infect the rice leaves at a concentration of 5 × 10⁵ spores mL−1. The rice cell plasma membrane was labeled with PIP2‐GFP to visualize cell profiles. The circles indicate the vascular tissues. Scale bars, 20 µm. d) The infection process of M. oryzae hyphae in rice leaves. The infection process was observed with SEM at 48 hpi in different rice leaf tissues. The circles indicate the vascular tissues. The red square area was enlarged to view the fungal hyphae. Red arrowheads indicate the infected area with fungal hyphae. Yellow color indicates the invasion hyphae of M. oryzae. Red frame indicates magnified invaded areas. V, vein; S, spore; AP, appressorium; IH, invasive hypha; GC, Guard cell. Scale bars, 10 µm.
Figure 4
Figure 4
Trajectory curves of rice epidermal cells in response to blast infection. a) The trajectory curve of epidermal cells from the infected rice leaves. 1714 genes (q value < 0.01) from infected samples were used to construct the trajectory curve. Each dot represents a single epidermal cell. The color of a dot indicates its pseudotime value. Number “1” indicates the branching points. b) Trajectory curves of epidermal cells from mock, 24, and 48 hpi samples. Epidermal cells at different time points were placed in chronological order along the trajectory curve. Each dot represents a single cell. The color indicates the infected cells at 0, 24, and 48 hpi. c) The curve uniformity between pseudotime and infection time during M. oryzae infection. The shift of pseudotime was set from “0” to “1” in the epidermal cells. The color indicates the infected samples at 0, 24, and 48 hpi. d) The cellular biological processes enriched in epidermal cells at different pseudotime values. The heatmap shows the expression levels of pseudotime‐dependent genes in the trajectory of epidermal cells. The genes were grouped into three populations based on hierarchical clustering. Representative gene ontology (GO) terms enriched in each population are listed. e) Cell‐type‐specific expression of MAPK signal pathway‐related genes during M. oryzae infection. Heatmaps show expression of MAPK signal pathway‐related genes from rice in each annotated cell type. The DEGs expression levels are indicated by colored average log2FC. p adj < 0.01, pct.1>0.1 for up‐regulated genes, and pct.2 > 0.1 for down‐regulated genes, |average log2FC|>1.0. M, Mesophyll; X, Xylem; F, Fiber; Pr, Procambium; MS, Mestome sheath; E, Epidermis; GC, Guard cell; Ph, Phloem; LP, Large parenchyma.
Figure 5
Figure 5
Spatial transcriptome revealed dynamic expression of immune receptor genes. a) Schematic diagram of spatial transcriptomic RNA sequencing (stRNA‐seq) for rice leaves. Rice leaf fragments (2 cm) were rolled up and sliced longitudinally to fit in the sequencing chip (0.68 cm × 0.68 cm) for stRNA‐seq. The UMI counts in the arrays were matched to the physical position of leaf tissues. To visualize the gene expression linearly, the “rolled” spots assigned to the leaf fragments were reshaped to a horizontal curve by the program LOONG v1.0 (described in Material and Methods). The position of “0 cm” is the inoculation site. Each assay has two biological replicates. b) Heatmap and barplot assays were used to characterize the numbers of detected NLR‐related immune receptor genes. The leaf fragment (2 cm) was equally divided into 40 plots. Barplot shows the expression ratio of all detected genes based on heatmaps (lower panels) at different plots. The fit lines represent a fitted expression ratio value calculated by R function “mgcv::gam”. The ratio of detected gene numbers was curve fitted for the leaf fragments at 0, 6, 12, and 24 hpi. “0 cm” is the infection site. Expression ratio indicates the number of detectable NLR genes versus the number of total detectable genes in each leaf fragments. “Dotted line” indicates the infection site. c) The relative expression levels of defense responsive genes OsPR10, OsPBZ1, OsWRKY45, and PRR gene LOC_Os12g436e60 in rice leaf fragments. The leaves of two‐week‐old plants were inoculated with M. oryzae spores. Four centimeters of leaf fragments centering the inoculation site were sampled for RT‐qPCR assay at 24 hpi. OsActin1 was used as the internal reference gene. Letters indicate the significant difference between the expression levels at different sites by one‐way ANOVA at p < 0.05 (n = 3 biological repeats). d) Disease symptoms of rice leaves infected by M. oryzae. Disease symptoms were observed after spray‐inoculated with M. oryzae spores at a concentration of 5 × 10⁵ spores mL−1. The photos were taken at 5 dpi. Scale bars, 4 mm. e) Statistical analysis of lesion length from the lesion midpoint toward two different directions (base and tip). The leaves were sampled from protected paddy fields. “****” represents the significance between the two samples by Student's t‐test at p < 0.0001.
Figure 6
Figure 6
OsHKT9 is required for blast disease resistance in rice. a) The trajectory curve of procambium cells from the infected rice leaves. 1764 genes (q value <0.01) from infected samples were used to construct the trajectory curve. The color of a dot indicates its pseudotime value. Each dot represents a single epidermal cell. b) Trajectory curves of procambium cells from mock, 24, and 48 hpi samples. Each dot represents a single procambium cell. The color indicates the infection time. c) The curve uniformity between pseudotime and infection time of M. oryzae. A shift of pseudotime was set from “0” to “1” in the procambium cells. The color indicates the infected samples at 0, 24, and 48 hpi. d) Cellular processes were enriched in procambium cells that have different pseudotime values. The heatmap shows relative expression levels of pseudotime‐dependent genes in the trajectory of procambium cells. The processes were grouped into three populations based on hierarchical clustering. Representative gene ontology (GO) terms enriched in each population are highlighted. e) Trajectory heatmap of the spatial expression of OsHKT9. OsHKT9 expression was examined by stRNA‐seq with dynamically spatial value in infected rice leaf fragments. The red arrowheads point to the dynamic expression of OsHKT9 at different leaf positions during infection. f) OsHKT9 mutant plants exhibited reduced disease resistance to M. oryzae. Left panel, disease symptoms by punch inoculation with M. oryzae spores; Right panel, measurement of the lesion length. “***” represents p < 0.001 (Student's t‐test, n = 4 biological replicates). g) Micrographs of rice sheath inoculated with M. oryzae. M. oryzae strain Guy11‐mCherry was used to observe the infection. Images were taken at 48 and 72 hpi. Scale bars, 10 µm. h) The model of spatiotemporal landscape of the interaction between rice and M. oryzae. The vascular tissues mount defenses by producing phytoalexin and expressing immune proteins at early infection stages (prior to 48 hpi) and consequently prevent the pathogen from colonizing vascular tissues. In the longitudinal direction, the neighboring cells surrounding the inoculation site exhibited strong immune responses by activating potassium ion transport in procambium cells, which restricts further pathogen infection of the tissues. The immune strength is stronger toward the leaf tip than that of the leaf base. The curve indicates the immune output at the longitudinal axis. Solid line represents the detected spatial defense gene expression. Gray cells showing the lesion. Greener cells show the local acquired resistance (LAR).

References

    1. Ngou B. P. M., Ding P., Jones J. D. G., Plant Cell 2022, 34, 1447. - PMC - PubMed
    1. Guo Y. L., Fitz J., Schneeberger K., Ossowski S., Cao J., Weigel D., Plant Physiol. 2011, 157, 757. - PMC - PubMed
    1. Li L., Yu Y., Zhou Z., Zhou J. M., Sci. China Life Sci. 2016, 59, 878. - PubMed
    1. Fritz‐Laylin L. K., Krishnamurthy N., Tör M., Sjölander K. V., Jones J. D. G., Plant Physiol. 2005, 138, 611. - PMC - PubMed
    1. Luo S., Zhang Y.u, Hu Q., Chen J., Li K., Lu C., Liu H., Wang W., Kuang H., Plant Physiol. 2012, 159, 197. - PMC - PubMed

MeSH terms

Supplementary concepts

LinkOut - more resources