. 2024 Oct 4;7(4):101226.
doi: 10.1016/j.jhepr.2024.101226. eCollection 2025 Apr.

Soluble TREM2 reflects liver fibrosis status and predicts postoperative liver dysfunction after liver surgery

Affiliations

Soluble TREM2 reflects liver fibrosis status and predicts postoperative liver dysfunction after liver surgery

Jonas Santol et al. JHEP Rep. .

Abstract

Background & aims: Triggering receptor expressed on myeloid cells 2 (TREM2)-expressing macrophages and systemic levels of soluble TREM2 (sTREM2) appear critical in the development of chronic liver disease (CLD) and seem relevant in its detection. The aim of this study was to examine sTREM2 as a marker for early CLD and its potential to predict posthepatectomy liver failure (PHLF) in patients undergoing partial hepatectomy.

Methods: sTREM2 was assessed in the plasma of 108 patients undergoing liver resection. Blood was drawn prior to surgery (preop) and on the first and fifth postoperative day.

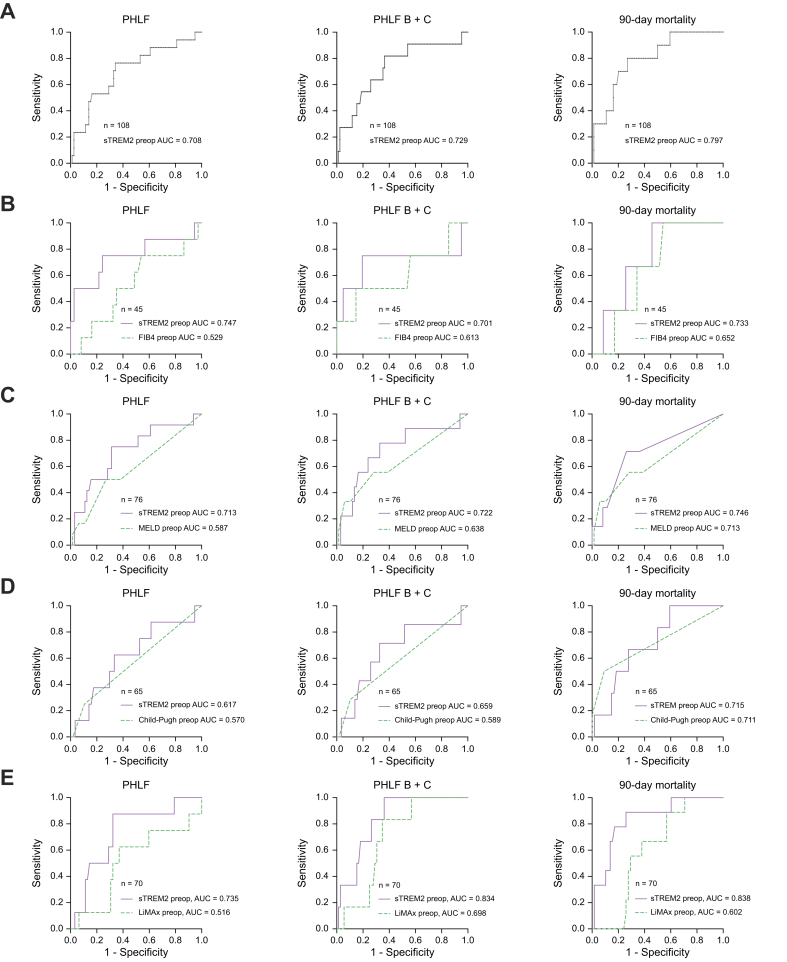
Results: Preop sTREM2 levels were similar across different indications for resection (p = 0.091). Higher preop sTREM2 levels were associated with advanced hepatic fibrosis (p = 0.030) and PHLF (p = 0.007). Fibrosis-4 index (FIB-4) (p = 0.619) and model for end-stage liver disease (MELD) (p = 0.590) did not show a difference between patients grouped by their CLD. Comparing the AUC from receiver-operating characteristic analysis, sTREM2 (AUC = 0.708) outperformed FIB-4 (AUC = 0.529), MELD (AUC = 0.587), Child-Pugh grading (AUC = 0.570) and LiMAx (liver maximum capacity test) (AUC = 0.516) in predicting PHLF. Similarly, in uni- and multivariate analysis, only sTREM2 proved predictive for PHLF (p = 0.023). High-risk (p = 0.003) and low-risk (p = 0.011) cut-offs for systemic sTREM2 levels could identify patients at risk for adverse outcomes after surgery. Finally, high sTREM2 was associated with decreased overall survival after liver surgery (p <0.001).

Conclusions: Circulating sTREM2 shows sensitivity for early-stage, asymptomatic liver disease, irrespective of the underlying indication for liver surgery. Assessment of CLD via sTREM2 monitoring could improve early detection of CLD and improve outcomes after liver surgery.

Impact and implications: Soluble TREM2 (sTREM2) has previously been shown to correlate with the degree of chronic liver disease. We found that even in patients undergoing liver resection, who generally do not suffer from end-stage liver disease, sTREM2 reflects liver fibrosis status and predicts postoperative development of liver dysfunction. This is especially relevant for liver surgeons and patients, as postoperative liver dysfunction is the main reason for postoperative mortality. Our findings are also important for hepatologists, as early detection of liver fibrosis and cirrhosis is paramount for overall patient survival and we can show that even in a cohort with a median model for end-stage liver disease score of 6, sTREM2 is able to distinguish patients based on their liver fibrosis status.

Keywords: Cirrhosis; Liver fibrosis; Liver regeneration; Liver surgery; Soluble TREM2.


Conflict of interest statement

None of the authors have any type of conflict of interest to declare in regards to the writing of this manuscript. Please refer to the accompanying ICMJE disclosure forms for further details.

Figures

Image 1
Graphical abstract
Fig. 1
Fig. 1
Systemic sTREM2 levels are associated with fibrosis stage, irrespective of tumor type. (A) Preop sTREM2 levels in circulation of patients with different tumor types (p = 0.091, Kruskal-Wallis test). (B) Violin plots of measured preop sTREM2 levels in patients grouped according to early- and late-stage liver fibrosis (p = 0.030, Mann-Whitney U test). (C) Violin plots of FIB-4 index results of patients grouped according to early- and late-stage liver fibrosis (p = 0.619, Mann-Whitney U test). (D) Scatter plot for the correlation of preop sTREM2 levels and preop FIB-4 index (R = 0.226, p = 0.135, Spearman correlation). (E) Violin plots of MELD scores of patients grouped according to early- and late-stage liver fibrosis (p = 0.590, Mann-Whitney U test). (F) Scatter plot for the correlation of preop sTREM2 and preop MELD (R = 0.399, p <0.001, Spearman correlation). Levels of significance: ∗p <0.05. (A, B, C, E) Dotted lines represent quartiles and bold lines inside the violin plots represent median levels. CRCLM, colorectal cancer liver metastases; CCA, cholangiocarcinoma; HCC, hepatocellular carcinoma; MELD, model for end-stage liver disease; sTREM2, soluble TREM2.
Fig. 2
Fig. 2
sTREM2 levels correlate with parameters of non-invasive liver function assessment. Scatter plot for the correlation of preop sTREM2 titers and (A) preop SB (R = 0.442, p <0.001, Pearson correlation), as well as SB on POD1 (R = 0.238, p = 0.021, Pearson correlation) and POD5 (R = 0.400, p <0.001, Pearson correlation) and (B) preop PT (R = -0.288, p = 0.007, Pearson correlation), as well as PT on POD1 (R = -0.312, p = 0.002, Pearson correlation) and POD5 (R = -0.442, p <0.001, Pearson correlation). (C) Scatter plot for the correlation of preop sTREM2 levels with preop albumin (R = -0.272, p = 0.025, Pearson correlation), ALT (R = 0.274, p = 0.031, Pearson correlation) and AST (R = 0.318, p = 0.009, Pearson correlation). (D) Scatter plot for the correlation of preop sTREM2 levels and preop AP (R = 0.451, p <0.001, Pearson correlation), as well as AP on POD1 (R = 0.482, p <0.001, Pearson correlation) and POD5 (R = 0.372, p = 0.002, Pearson correlation). ALT, alanine aminotransferase; AST, aspartate aminotransferase; AP, alkaline phosphatase; CLD, chronic liver disease; GGT, gamma-glutamyltransferase; POD, postoperative day; PT, prothrombin time; SB, serum bilirubin.
Fig. 3
Fig. 3
High systemic sTREM2 levels are associated with adverse outcomes after liver surgery. Violin plots of sTREM2 concentrations in patients grouped according to development of (A) PHLF (p = 0.007, Mann-Whitney U test), (B) severe postop morbidity (p <001., Mann-Whitney U test), (C) 90-day mortality (p = 0.002, Mann-Whitney U test). Levels of significance: ∗p <0.05, ∗∗p <0.005. Dotted lines represent quartiles and bold lines inside the violin plots represent median levels. PHLF, posthepatectomy liver failure; sTREM2, soluble TREM2.
Fig. 4
Fig. 4
sTREM2 outperforms established markers for chronic liver disease in prediction of PHLF and postop mortality. (A) Receiver-operating characteristic curve analysis and calculation of the AUC of systemic preop sTREM2 levels for the assessment of the predictive potential for PHLF (AUC = 0.708), PHLF B+C (AUC = 0.729) and 90-day mortality (AUC = 0.797). Receiver-operating characteristic curve analysis and calculation of the AUC of systemic preop sTREM2 levels and (B) preop FIB-4 index (PHLF: sTREM2, AUC = 0.747; FIB-4, AUC = 0.529) (PHLF B+C: sTREM2, AUC = 0.701; FIB-4, AUC = 0.613) (90-day mortality: sTREM2, AUC = 0.733; FIB-4, AUC = 0.652), (C) preop MELD score (PHLF: sTREM2, AUC = 0.713; MELD, AUC = 0.587) (PHLF B+C: sTREM2, AUC = 0.722; MELD, AUC = 0.638) (90-day mortality: sTREM2, AUC = 0.746; MELD, AUC = 0.713), (D) preop Child-Pugh score (PHLF: sTREM2, AUC = 0.617; Child-Pugh, AUC = 0.570) (PHLF B+C: sTREM2, AUC = 0.659; Child-Pugh, AUC = 0.589) (90-day mortality: sTREM2, AUC = 0.715; Child-Pugh, AUC = 0.711) and (E) LiMAx (PHLF: sTREM2, AUC = 0.747; LiMAx, AUC = 0.516) (PHLF B+C: sTREM2, AUC = 0.701; LiMAx, AUC = 0.698) (90-day mortality: sTREM2, AUC = 0.733; LiMAx, AUC = 0.602) for the comparison of the predictive potential for PHLF, PHLF B+C and 90-day mortality. n = number of patients available for comparison of the AUC. FIB-4, fibrosis-4 index; LiMAx, liver maximum capacity test; MELD, model for end-stage liver disease; PHLF, posthepatectomy liver failure; sTREM2, soluble TREM2.
Fig. 5
Fig. 5
High sTREM2 is associated with decreased OS after liver surgery. Long-term OS in patients grouped according to a low-risk sTREM2 cut-off of 3.452 μg/ml (Preop sTREM2 <3.452 μg/ml: No. of events = 9, did not reach median OS; Preop sTREM2 ≥3.452 μg/ml: No. of events = 20, median OS = 19.8 months; p <0.001, Kaplan-Meier survival analysis, log-rank test). OS, overall survival; sTREM2, soluble TREM2.
Fig. 6
Fig. 6
Plasma sTREM2 dynamics across the perioperative time course are influenced by PHLF development and fibrosis stage. (A) Perioperative dynamics of plasma sTREM2 levels (Preop to POD1, p <0.001, Wilcoxon test; POD1 to POD5, p = 0.015, Wilcoxon test; Preop to POD5, p = 0.011, Wilcoxon test). (B) Perioperative changes in plasma sTREM2 levels in patients grouped according to PHLF development (Preop to POD1 no PHLF, p <0.001, Wilcoxon test; Preop to POD1 PHLF, p <0.001, Wilcoxon test) (POD1 to POD5 no PHLF, p = 0.008, Wilcoxon test; POD1 to POD5 PHLF, p = 0.807, Wilcoxon test) (Preop to POD5 no PHLF, p = 0.197, Wilcoxon test; Preop to POD5 PHLF, p = 0.002, Wilcoxon test). (C) Perioperative sTREM2 dynamics in patients grouped according to fibrosis stage (Preop to POD1 no PHLF, p <0.001, Wilcoxon test; Preop to POD1 PHLF, p <0.001, Wilcoxon test) (POD1 to POD5 no PHLF, p = 0.080, Wilcoxon test; POD1 to POD5 PHLF, p = 0.575, Wilcoxon test) (Preop to POD5 no PHLF, p = 0.067, Wilcoxon test; Preop to POD5 PHLF, p = 0.017, Wilcoxon test). Levels of significance: ∗p <0.05, ∗∗p <0.005. Dotted lines represent quartiles and bold lines inside the violin plots represent median levels. PHLF, posthepatectomy liver failure; POD, postoperative day; sTREM2, soluble TREM2.

References

    1. Moon A.M., Singal A.G., Tapper E.B. Contemporary epidemiology of chronic liver disease and cirrhosis. Clin Gastroenterol Hepatol. 2020;18(12):2650–2666. - PMC - PubMed
    1. Younossi Z., Tacke F., Arrese M., et al. Global perspectives on nonalcoholic fatty liver disease and nonalcoholic steatohepatitis. Hepatology. 2019;69(6):2672–2682. - PubMed
    1. Huang D.Q., Mathurin P., Cortez-Pinto H., et al. Global epidemiology of alcohol-associated cirrhosis and HCC: trends, projections and risk factors. Nat Rev Gastroenterol Hepatol. 2023;20(1):37–49. - PMC - PubMed
    1. Israelsen M., Torp N., Johansen S., et al. MetALD: new opportunities to understand the role of alcohol in steatotic liver disease. Lancet Gastroenterol Hepatol. 2023;8(10):866–868. - PubMed
    1. Harrison S.A., Bedossa P., Guy C.D., et al. A phase 3, randomized, controlled trial of resmetirom in NASH with liver fibrosis. N Engl J Med. 2024;390(6):497–509. - PubMed

LinkOut - more resources