. 2025 Mar 7:16:1546429.
doi: 10.3389/fimmu.2025.1546429. eCollection 2025.

Divergent B-cell and cytotoxic TNK cell activation signatures in HLA-B27-associated ankylosing spondylitis and acute anterior uveitis

Affiliations

Divergent B-cell and cytotoxic TNK cell activation signatures in HLA-B27-associated ankylosing spondylitis and acute anterior uveitis

Eisa Mahyari et al. Front Immunol. .

Abstract

Ankylosing spondylitis (AS), also known as radiographic axial spondyloarthritis (r-axSpA), is an immune-mediated inflammatory disorder frequently associated with acute anterior uveitis (AAU). Both conditions share a strong association with the genetic risk factor, human leukocyte antigen (HLA)-B27. However, the immunophenotype underlying HLA-B27-associated AS and/or AAU pathophysiology remains known. Using cellular indexing of transcriptomes and epitopes (CITE-Seq) in a well-characterized cohort of 25 subjects-including AS (HLA-B27pos), AS+AAU (HLA-B27pos), AAU (HLA-B27pos), HCs (HLA-B27pos), and HCs (HLA-B27neg); N = 5/group-we identified transcriptomic differences at the single-cell level, along with differentially expressed cell surface markers. Our study elucidates both shared and distinct immune alterations linked to HLA-B27 and disease. Furthermore, we employed sparse decomposition of arrays (SDA) analysis, an unsupervised machine learning method, to examine the high-dimensional transcriptional landscape of our data and identify complex and nonlinear relationships. Our study identified HLA-B27- and disease-specific transcriptomic differences in AS and AAU. The immune profiles of AS+AAU closely resembled those of AS, suggesting AS plays a dominant role in immune dysregulation. SDA analysis further revealed dysregulated B-cell maturation and activation in AS subjects, whereas AAU subjects exhibited an enrichment of cytotoxic effector function in T and NK cells. However, both AS and AAU exhibited myeloid cell activation, a key process in initiating and sustaining inflammation. Additionally, both AS and AAU subjects showed a dampening in homeostatic function, i.e., the balance between identifying and actively eliminating foreign pathogens while preventing an immune response against self-antigens, suggesting that inflammation may arise from immune dysregulation. In conclusion, our results highlight overlapping myeloid effector involvement, along with distinct immunophenotypic responses, such as a decrease in naive B cells in AS subjects and a reduction in the CD8/NK cell population in AAU subjects. These results highlight a distinct set of immune mediators driving AS and AAU pathogenesis. Future studies incorporating HLA-B27-negative AS and AAU patients, along with validation of B-cell and myeloid dysfunction in these diseases, may provide novel biomarkers and therapeutic targets.

Keywords: HLA-B27; acute anterior uveitis; ankylosing spondylitis; immunophenotype; single cell CITE sequencing.


Conflict of interest statement

Author JTR was employed by company Corvus Pharmaceuticals. ES declares the following: research support from Roche/Genentech, Priovant, Alimera/EyePoint, and Acelyrin. Consultancy roles with Roche/Genentech, Priovant, Alimera/EyePoint, Acelyrin, Merck, Alumis, and Kriya. AD declares the following: Advisory board memberships with Bristol Myers Squibb, Eli Lilly, Janssen, Novartis, and UCB. Speaker engagements for Eli Lilly, Janssen, MoonLake, Novartis, Pfizer, and UCB. Research grants from Bristol Myers Squibb, Eli Lilly, Janssen, MoonLake, Novartis, Pfizer, and UCB. The remaining authors declare that the research was conducted in the absence of any commercial or financial relationships that could be construed as a potential conflict of interest.

Figures

Figure 1
Figure 1
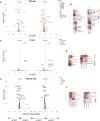
Quantification of the HLA-B27-associated immune landscape in HC. Healthy controls (HC) with and without HLA-B27 (N = 5 per group) were compared to identify differential immune features. Differential expression analysis was performed for each of the major cell lineages: (A) TNK cells, (C) B cells, and (E) myeloid cells. Volcano plots illustrate genes with significant differential expression (adjusted p-value < 0.05), with uniquely labeled genes representing those with the largest log2 fold changes within each subphenotype. Cellular enrichment for subpopulations within (B) TNK cells, (D) B cells, and (F) myeloid cells was assessed using Chi-squared residuals calculated from observed vs. expected frequencies. The values displayed in the heatmaps represent Chi-squared residuals of observed vs. expected frequencies for each cell subset under the indicated conditions. Positive residuals indicate a higher-than-expected frequency (enrichment), while negative residuals indicate a lower-than-expected frequency (depletion). Heatmaps display the enrichment patterns, with orange indicating enrichment (higher-than-expected frequencies) and blue indicating depletion (lower-than-expected frequencies). These visualizations summarize significant differences in cellular composition between HLA-B27pos and HLA-B27neg HC groups.
Figure 2
Figure 2
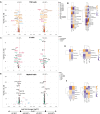
Quantification of the immune landscape in AS. Subjects with ankylosing spondylitis (AS) were compared to healthy controls (HC) with and without HLA-B27. Differential expression analysis was performed for each major cell lineage: (A) TNK cells, (C) B cells, and (E) myeloid cells. Volcano plots display genes with significant differential expression (FDR-adjusted p-value < 0.05). Comparisons to HLA-B27neg HC are shown on the left, while comparisons to HLA-B27-positive HC are shown on the right. Genes with the largest log2 fold changes are uniquely labeled in the plots for each subphenotype. Cellular enrichment for subpopulations within (B) TNK cells, (D) B cells, and (F) myeloid cells was assessed using Chi-squared residuals, calculated from observed vs. expected frequencies. The values displayed in the heatmaps represent Chi-squared residuals of observed vs. expected frequencies for each cell subset under the indicated conditions. Positive residuals indicate a higher-than-expected frequency (enrichment), while negative residuals indicate a lower-than-expected frequency (depletion). Heatmaps illustrate enrichment patterns, with orange indicating enrichment (higher-than-expected frequencies) and blue indicating depletion (lower-than-expected frequencies). The left panels of the heatmaps summarize comparisons across all HC, while the right panels focus on comparisons stratified by HLA-B27 status.
Figure 3
Figure 3
Quantifying the immune landscape in AAU. Subjects with acute anterior uveitis (AAU) were compared to healthy controls (HC) with and without HLA-B27. Differential expression analysis was performed for each major cell lineage: (A) TNK cells, (C) B cells, and (E) myeloid cells. Volcano plots display genes with significant differential expression (FDR-adjusted p-value < 0.05). Comparisons to HLA-B27neg HC are shown on the left, while comparisons to HLA-B27-positive HC are shown on the right. Genes with the largest log2 fold changes are uniquely labeled in the plots for each subphenotype. Cellular enrichment for subpopulations within (B) TNK cells, (D) B cells, and (F) myeloid cells was assessed using Chi-squared residuals, calculated from observed vs. expected frequencies. The values displayed in the heatmaps reflect Chi-squared residuals of observed vs. expected frequencies for each cell subset under the indicated conditions. Positive residuals indicate a higher-than-expected frequency (enrichment), while negative residuals indicate a lower-than-expected frequency (depletion). Heatmaps illustrate enrichment patterns, with orange indicating enrichment (higher-than-expected frequencies) and blue indicating depletion (lower-than-expected frequencies). The left panels of the heatmaps summarize comparisons across all HC, while the right panels focus on comparisons stratified by HLA-B27 status.
Figure 4
Figure 4
Comparison of AS, AAU, and AAU/AS donors. To complement the previous differential expression analysis at the subphenotype level, we compared three groups of donors: ankylosing spondylitis (AS), acute anterior uveitis (AAU), and those with both conditions (AS+AAU). Differential expression analysis was conducted for each major cell lineage: (A) TNK cells, (C) B cells, and (E) myeloid cells. Volcano plots illustrate genes with significant differential expression (FDR-adjusted p-value < 0.05) for the following comparisons: AS+AAU vs. AAU (left), AS+AAU vs. AS (middle), and AS vs. AAU (right). Genes with the largest log2 fold changes are uniquely labeled in each plot for clarity. Cellular enrichment of subpopulations within (B) TNK cells, (D) B cells, and (F) myeloid cells were assessed using Chi-squared residuals, calculated from observed vs. expected frequencies. The values displayed in the heatmaps reflect Chi-squared residuals of observed vs. expected frequencies for each cell subset under the indicated conditions. Positive residuals indicate a higher-than-expected frequency (enrichment), while negative residuals indicate a lower-than-expected frequency (depletion). Heatmaps illustrate these enrichment patterns, with orange indicating enrichment (higher-than-expected frequencies) and blue indicating depletion (lower-than-expected frequencies) across the AS, AAU, and AS+AAU groups. Venn diagrams (G–I) summarize the overlap and differences in significantly altered genes between these disease states for (G) TNK cells, (H) B cells, and (I) myeloid cells, highlighting the shared and distinct transcriptional signatures among the conditions.
Figure 5
Figure 5
The SDA component (SDA48) associated with myeloid regulation imbalance (MRI) implicates myeloid cell activation and metabolic homeostasis as underlying factors in both AS and AAU. We performed an SDA analysis and identified a myeloid regulation imbalance (MRI) component—a unique gene signature that distinguishes inflammatory immune activation (positive) from metabolic and signal regulation (negative). The gene loadings for this component are shown in (A), sorted by their mapping locations on the human chromosome. The top-weighted genes in positive and negative directions are shown. The top-loaded genes were used for GO enrichment (see Material and methods), and the results are visualized in (B), highlighting significant potential matches. In (C), the distribution of these cells within this component is shown, stratified by immune subphenotypes, while (D) displays the distribution across disease conditions. To quantify the differences in these distributions, we assessed the enrichment of cells that scored either positively or negatively in (E).
Figure 6
Figure 6
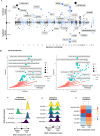
The SDA component (SDA 76) B-cell defect signature (BCDS) differentiates disease pathogenesis between AS and AAU subjects. This component features a unique gene signature that distinguishes naive B cells (negative) from memory and intermediate B cells, as well as plasmablasts (positive). Moreover, this signature identifies AS—but not AAU—as enriched with naive B cells, suggesting potential dysregulation in B-cell maturation and class switching. The gene loadings for this component are shown in (A), sorted by their mapping locations on the human chromosome. The top-weighted genes in positive and negative directions are shown. The top-loaded genes were used for GO enrichment (see Material and methods), and the results are visualized in (B), highlighting significant potential matches. The distribution of these cells, as scored by this component, is displayed in (C) for immune subphenotypes and in (D) for disease conditions. To quantify the differences in these distributions, we performed an enrichment assessment of cells that scored either positively or negatively in (E).
Figure 7
Figure 7
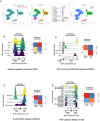
Validation of SDA components identified in this study using a published dataset. (A) Cross-study UMAP overlap. Single-cell data from our CITE-Seq study (teal, left panel) and the published AS dataset (orange, left panel) were integrated and visualized using UMAP. The middle panel shows the cellular subclusters (N = 28), while the right panel presents cellular clustering by broad cell type (e.g., B cells, myeloid cells, TNK cells) across both datasets. These figures highlight the cellular overlap between our dataset and the published dataset, enabling projection of SDA components identified in our dataset onto the published dataset. (B–E) Distribution plots and enrichment heatmaps. Each panel represents one of the four sparse decomposition analysis (SDA) components identified as relevant in our study: (B) myeloid regulation imbalance (MRI), (C) pDC–monocyte differential signature (PMDS), (D) B-cell defect signature (BCDS), and (E) TNK cytotoxic module (TCM). In each figure (B–E), the left panel displays cell distribution plots, where the x-axis represents the SDA component “score” for each cell, derived from the underlying gene set. Cells are categorized as “negative” vs. “positive” based on whether their component score falls below or above zero. Cells with higher scores (to the right) exhibit stronger expression of the genes driving the SDA component, whereas those with lower scores (toward the left) express those genes at reduced levels. The colored curves represent the distribution of component scores within different subphenotypes (e.g., cDC1, pDC, CD14 Mono). Peaks shifted to the right indicate greater expression of the component’s gene set within that subphenotype. Likewise, in each figure (B–E), the right panel displays the enrichment of these cells in AS vs. HC from the published datasets. These heatmaps illustrate whether AS or HC samples are overrepresented (enriched) or underrepresented (depleted) among cells with positive vs. negative scores. The numeric scale (e.g., − 3 to + 3) represents standardized residuals (e.g., χ 2 residuals or Z-scores). Positive values (red) indicate enrichment, while negative values (blue) indicate depletion of that subset or condition beyond what is expected by chance. These values were calculated using a Chi-squared test (or a similar enrichment test) by comparing observed vs. expected cell frequencies in each group. Detailed methods, including significance thresholds and any corrections for multiple comparisons, are provided in the Material and methods section. Taken together, panels (B–E) confirm that the SDA components identified in our main dataset are recapitulated in an independent, published AS cohort, highlighting specific immune subsets (e.g., myeloid cells, pDCs, B cells, T/NK cells) that exhibit disease-associated signature scores in AS vs. HC.

References

    1. Taurog JD, Chhabra A, Colbert RA. Ankylosing spondylitis and axial spondyloarthritis. N Engl J Med. (2016) 374:2563–74. doi: 10.1056/NEJMra1406182 - DOI - PubMed
    1. Magrey MN, Danve AS, Ermann J, Walsh JA. Recognizing axial spondyloarthritis: A guide for primary care. Mayo Clin Proc. (2020) 95:2499–508. doi: 10.1016/j.mayocp.2020.02.007 - DOI - PubMed
    1. Stolwijk C, Van Tubergen A, Castillo-Ortiz JD, Boonen A. Prevalence of extra-articular manifestations in patients with ankylosing spondylitis: a systematic review and meta-analysis. Ann Rheum Dis. (2015) 74:65–73. doi: 10.1136/annrheumdis-2013-203582 - DOI - PubMed
    1. Rizzo A, Ferrante A, Guggino G, Ciccia F. Gut inflammation in spondyloarthritis. Best Pract Res Clin Rheumatol. (2017) 31:863–76. doi: 10.1016/j.berh.2018.08.012 - DOI - PubMed
    1. Rosenbaum JT. The eye in spondyloarthritis(☆). Semin Arthritis Rheum. (2019) 49:S29–s31. doi: 10.1016/j.semarthrit.2019.09.014 - DOI - PMC - PubMed

Substances

LinkOut - more resources