. 2025 Mar 20:13:e19050.
doi: 10.7717/peerj.19050. eCollection 2025.

NCBP2 predicts the prognosis and the immunotherapy response of cancers: a pan-cancer analysis

Affiliations

NCBP2 predicts the prognosis and the immunotherapy response of cancers: a pan-cancer analysis

Shichao Li et al. PeerJ. .

Abstract

Background: The cap-binding complex (CBC) plays a crucial role in facilitating gene expression by safeguarding mRNA from nonsense-mediated decay, promoting mRNA splicing, 3'-end processing, and facilitating nuclear export. Nevertheless, the precise biological functions and clinical implications of CBC in cancer remain ambiguous, necessitating further investigation for clarification.

Methods: The present study utilized the cBioPortal database to investigate the genetic alterations of nuclear cap binding protein subunit 2 (NCBP2) in pan-cancer. The Cancer Genome Atlas (TCGA) and online web tools were employed to analyze the correlation between NCBP2 and prognosis, genome instability, immune infiltration, immune response, cancer stemness, and chemotherapeutic efficacy in pan-cancer. Furthermore, the expression of NCBP2 was confirmed by immunohistochemistry (IHC) and functional analysis at the single-cell level was conducted using the CancerSEA database.

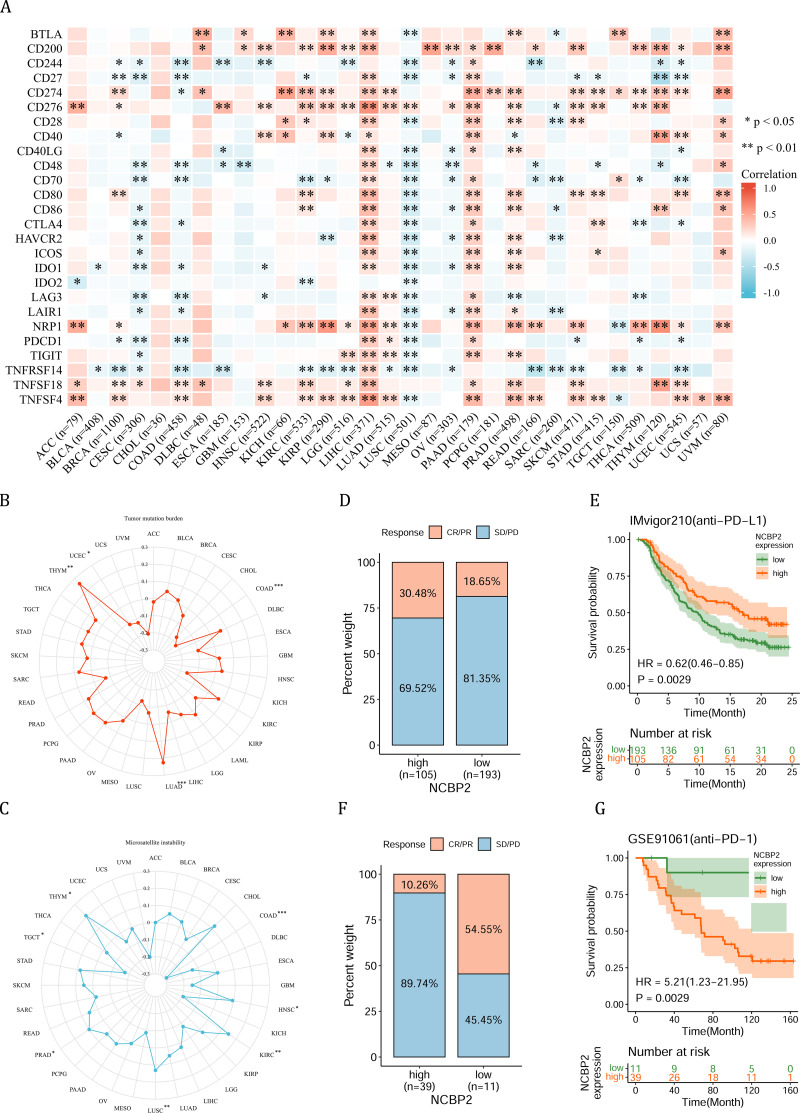
Results: NCBP2 exhibited distinct genetic alterations in pan-cancer with an increased expression in 24/32, while decreased expression in 3/32, types of cancers. IHC confirmed the aberrant expression of NCBP2 in lung squamous cell carcinoma (LUSC), pancreatic adenocarcinoma (PAAD), kidney renal papillary cell carcinoma (KIRP) and kidney renal clear cell carcinoma (KIRC). NCBP2 was correlated with overall survival (OS), disease-specific survival (DSS), and progression-free survival (PFS) in various cancers. Importantly, it was identified as a risk factor for OS, DSS and PFS in PAAD and uterine corpus endometrial carcinoma (UCEC). Gene Set Enrichment Analysis (GSEA) demonstrated that elevated NCBP2 was linked to immune and proliferation related pathways across multiple cancer types. Furthermore, a negative association between NCBP2 and stromal score, immune score, and ESTIMATE score was detected, and a positive correlation was observed between NCBP2 and diverse immune cells as well as stemness-indexes in the majority of cancer types. Drug sensitivity analysis revealed that drugs associated with NCBP2 primarily targeted DNA replication, chromatin histone methylation, ABL signaling, cell cycle, and PI3K signaling. Additionally, an examination at the single-cell level indicated that NCBP2 was positively correlated with cell cycle progression, DNA damage, DNA repair, invasion, and stemness in most cancer types, while negatively correlated with apoptosis, inflammation, and hypoxia in certain cancers.

Conclusion: In this study, we revealed the correlation of NCBP2 with prognosis, microenvironment and stemness, indicating that NCBP2 might be a potential therapeutic target for more effective and personalized therapy strategies in pan-cancer.

Keywords: Immunotherapy; NCBP2; Pan-cancer; Prognosis.


Conflict of interest statement

The authors declare there are no competing interests.

Figures

Figure 1
Figure 1. The genetic alteration of NCBP2 in pan-cancer.
(A) Genomic alteration profiles of NCBP1, NCBP2, NCBP3, NCBP2-AS1, NCBP2AS2 and NCBP2L in TCGA pan-cancer cohort. (B–C) Kaplan–Meier survival analysis showed OS (B) and DFS (C) in all pan-cancer patients divided by NCBP2 altered or unaltered groups. (D) The genomic alteration of NCBP2 in TCGA pan-cancer atlas, including mutation, amplification, deep deletion and multiple alterations.
Figure 2
Figure 2. The expression of NCBP2 in pan-cancer.
(A) The relative mRNA expression level of NCBP2 between tumor and normal tissues in pan-cancer from TCGA cohort. (B) The expression of NCBP2 in several cancer cell lines, including U-251, A-431, U2-OS, PC3 and MCF7 were detected by immunofluorescent staining in Human Protein Atlas. (C–F) The protein expression of NCBP2 in LUSC (C), KIRP (D), PAAD (E) and KIRC (F) and paired normal tissues were detected by immunohistochemical stain. *p < 0.05, **p < 0.01, ***p < 0.001.
Figure 3
Figure 3. Clinical prognostic significance of NCBP2 in pan-cancer.
(A) The correlation between NCBP2 and patients’ OS were shown by forest plot. (B–G) Kaplan–Meier survival analysis for patients with specific cancers (UCEC, PAAD, LIHC, KIRC, KICH and KIRP) base on the expression of NCBP2. (H–M) Multivariate cox regression analyses evaluated the prognostic independence of NCBP2 and clinicopathological features regarding OS of UCEC, PAAD, LIHC, KIRC, KICH and KIRP in TCGA datasets.
Figure 4
Figure 4. Gene set enrichment analysis of NCBP2 revealed its association with the cancer immune response.
Differential expressed genes (DEGs) were analyzed between the top and bottom 30% NCBP2 expression subgroup for each cancer in TCGA, following hallmarks gene set enrichment analysis (GSEA) of those DEGs to investigate the NCBP2-associated cancer processes. The size of the circle represents the false discovery rate (FDR) adjusted P value of each cancer enrichment item, and the color represents the normalized enrichment score (NES) of each enrichment item.
Figure 5
Figure 5. Association between tumor microenvironment and NCBP2 expression.
(A) Heatmap showing the correlation of NCBP2 expression and stromal score, immune score, and ESTIMATE score in pan-cancer. Positive correlation in red and negative correlation in blue. (B) Heatmap showing the correlation of NCBP2 and infiltration levels of immune cells including CD4+ T cells, CAF, progenitor, Endo, Eos, HSC, Tfh, gdT, NKT, regulatory T cells (Tregs), B cells, neutrophils, monocytes, macrophages, dendritic cells, NK cells, Mast cells and CD8+ T cells in cancers. Positive correlation in red and negative correlation in blue. *p < 1.05; **p < 0.01.
Figure 6
Figure 6. Association between immune-related factors and NCBP2.
(A) The Spearman correlation heatmap shows the correlation between the expression of NCBP2 and twenty-six immunomodulatory genes in pan-cancer. Red represents positive correlation and blue represents negative correlation. (B–C) Correlations between NCBP2 and tumor mutation burden (TMB) (B) and microsatellite instability (MSI) (C) in pan-cancer. (D) The proportion of patients who receive immunotherapy in the low- and high- NCBP2 subgroup in the IMvigor210 cohort (bladder cancer). (E) Kaplan–Meier curve of low- and high- NCBP2 subgroup in the IMvigor210 cohort. (F) The proportion of patients who receive immunotherapy in the low- and high- NCBP2 subgroup in the GSE91061 cohort (melanoma). (G) Kaplan–Meier curve of low- and high- NCBP2 subgroup in the GSE91061 cohort. *p < 0.05, **p < 0.01, ***p < 0.001.
Figure 7
Figure 7. Tumor stemness and chemotherapeutic value of NCBP2.
(A) Heatmap exhibited the relationship between NCBP2 and stemness indices across cancers. Positive correlation in red and negative correlation in blue. (B) (upper) The relationship between NCBP2 and drug sensitivity calculated by Spearman algorithm. The color of each column represents the p value, whereas the height of each column represents the correlation coefficient. Rs represents the drug sensitivity correlated with the NCBP2 expression. (lower) Dot plot visualized the signal pathways targeted by drugs which were sensitivity (blue) or resistant (red) to the NCBP2. The signal pathways were ranked by the frequency of being targeted. *p < 1.05; **p < 0.01.
Figure 8
Figure 8. Functional analysis of NCBP2 at single cell level.
(A) Correlation analysis between NCBP2 and cancer-related functional states at single cell level according to CancerSEA dataset. (B–D) The association between NCBP2 expression and several biological process in AML (B), UM (C), RB (D). (E–G) t-SNE diagrams were used to visualize NCBP2 expression profiles in AML (E), UM (F), RB (G).

References

    1. Arora R, Haynes L, Kumar M, McNeil R, Ashkani J, Nakoneshny SC, Matthews TW, Chandarana S, Hart RD, Jones SJM, Dort JC, Itani D, Chanda A, Bose P. NCBP2 and TFRC are novel prognostic biomarkers in oral squamous cell carcinoma. Cancer Gene Therapy. 2023;30:752–765. doi: 10.1038/s41417-022-00578-8. - DOI - PMC - PubMed
    1. Avdulov S, Li S, Van M, Burrichter D, Peterson M, Perlman DM, Manivel JC, Sonenberg N, Yee D, Bitterman PB, Polunovsky VA. Activation of translation complex eIF4F is essential for the genesis and maintenance of the malignant phenotype in human mammary epithelial cells. Cancer Cell. 2004;5:553–563. doi: 10.1016/j.ccr.2004.05.024. - DOI - PubMed
    1. Ayers M, Lunceford J, Nebozhyn M, Murphy E, Loboda A, Kaufman DR, Albright A, Cheng JD, Kang SP, Shankaran V, Piha-Paul SA, Yearley J, Seiwert TY, Ribas A, McClanahan TK. IFN-γ–related mRNA profile predicts clinical response to PD-1 blockade. Journal of Clinical Investigation. 2017;127:2930–2940. doi: 10.1172/jci91190. - DOI - PMC - PubMed
    1. Barsh GS, Singh MD, Jensen M, Lasser M, Huber E, Yusuff T, Pizzo L, Lifschutz B, Desai I, Kubina A, Yennawar S, Kim S, Iyer J, Rincon-Limas DE, Lowery LA, Girirajan S. NCBP2 modulates neurodevelopmental defects of the 3q29 deletion in Drosophila and Xenopus laevis models. PLOS Genetics. 2020;16(2):e1008590. doi: 10.1371/journal.pgen.1008590. - DOI - PMC - PubMed
    1. Batlle E, Clevers H. Cancer stem cells revisited. Nature Medicine. 2017;23:1124–1134. doi: 10.1038/nm.4409. - DOI - PubMed

Substances

LinkOut - more resources