. 2025 May;12(19):e2415626.
doi: 10.1002/advs.202415626. Epub 2025 Mar 24.

Development of MDM2-Targeting PROTAC for Advancing Bone Regeneration

Affiliations

Development of MDM2-Targeting PROTAC for Advancing Bone Regeneration

Sol Jeong et al. Adv Sci (Weinh). 2025 May.

Abstract

Proteolysis-targeting chimeras (PROTACs) degrade target proteins through the ubiquitin-proteasome system. To date, PROTACs are primarily used to treat various diseases; however, they have not been applied in regenerative therapy. Herein, this work introduces MDM2-targeting PROTACs customized for application in bone regeneration. An MDM2-PROTAC library is constructed by combining Nutlin-3 and CRBN ligands with various linker designs. Through a multistep validation process, this work develops MDM2-PROTACs (CL144 and CL174) that presented potent degradation efficiency and a robust inductive effect on the biomineralization. Next, this work performs whole-transcriptome analysis to dissect the biological effects of the CL144, and reveals the upregulation of osteogenic marker genes. Furthermore, CL144 effectively induced bone regeneration in bone graft and ovariectomy (OVX) models after local and systemic administration, respectively. In the OVX model, the combination treatment with CL144 and alendronate induced a synergistic effect. Overall, this study demonstrates the promising role of MDM2-PROTAC in promoting bone regeneration, marking the first step toward expanding the application of the PROTAC technology.

Keywords: MDM2; PROTAC; bone; osteoporosis; regenerative medicine.


Conflict of interest statement

The authors declare no conflict of interest.

Figures
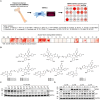
Figure 1
Figure 1
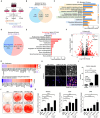
Development of MDM2‐targeting PROTAC compounds. A) Schematic representation of osteogenic differentiation using human bone marrow‐derived stem cells (hBMSCs), along with a list of MDM2 inhibitors, and their screening through Alizarin Red S (ARS) staining in hBMSCs. B) Structural schematic diagram of MDM2‐PROTAC compounds synthesized based on CL139 (Nutlin‐3). C) Degradation efficiency test of synthesized MDM2‐PROTAC compounds in hBMSCs; the bold numbers relative quantitative values, and GAPDH was used as the loading control. D) Degradation efficiency test of the initially selected four compounds (CL144, CL145, CL173, and CL174) with different concentration in hBMSCs; the bold numbers represent relative quantitative values, and GAPDH was used as the loading control.
Figure 2
Figure 2
Validation of the synthesized MDM2‐targeting PROTAC compounds. A–C) Evaluation of dissociation constant (Kd ) values of MDM2 ligand (Nutlin‐3) and MDM2‐PROTACs (CL144, CL174) though microscale thermophoresis (MST) assay; mean with SEM; n = 3. D,E) Predicted ternary structures of MDM2–CL144–CRBN. F,G) Predicted ternary structures of MDM2–CL174–CRBN; CRBN is shown as white illustrations and surfaces. MDM2 is shown as yellow illustrations and surfaces; Thalidomide, Nutlin‐3, and the linker components in the PROTAC are shown in magenta, green, and cyan, respectively. H,I) Evaluation of the maximal degradation concentration (Dmax ) and the half of maximal degradation concentration (DC50 ) values according to the concentration of the MDM2‐PROTACs (CL144, CL174); n = 2. J) Immunoprecipitation assay of MDM2 wild type and HA‐tagged ubiquitin was confirmed after treatment with 10 µM of CL144. K) Immunoblot assay under the condition of blocking the intracellular proteasome system using the proteasome inhibitor (Carfilzomib, Carf).
Figure 3
Figure 3
MDM2 proteolysis functional evaluation of MDM2‐PROTAC using EGFP‐MDM2 expressing cells. A) Experimental design of the PROTAC dynamics using EGFP‐MDM2 construct. B) luorescence images of EGFP‐MDM2 expressing cells treated with different concentrations of CL144; scale bar: 100 µm. C) Quantification of the number of EGFP‐MDM2 expressing cells and evaluation of Dmax and DC50 values; mean with SEM; n = 3. D) Pearson correlation analysis between quantitative results of western blot and EGFP‐MDM2 fluorescence intensity; Pearson r = 0.91; p < 0.05; mean with SEM; n = 3. E) Still images from live imaging of EGFP‐MDM2 expressing cells treated with MDM2‐PROTACs (CL144 and CL174); scale bar = 20 µm. F) Quantification results of live imaging of EGFP‐MDM2 expressing cells treated with newly developed MDM2‐PROTACs (CL144, CL174); Quantification values were calculated from the EGFP signals; mean with SEM; n = 3 to 8. G) Maximal degradation efficiency of MDM2‐PROTACs at 0.01 to 10 µM concentrations; ANOVA Bonferroni test: ****p < 0.0001; mean with SEM; n = 3 to 8.
Figure 4
Figure 4
Comparative analysis of MDM2 targeting small molecule (Nutlin‐3) and PROTAC (CL144). A) Schematic diagram of bulk RNA‐seq in cultured hBMSC models. B) Venn diagram of between‐group comparisons of enriched gene ontology (GO) terms (padj<0.05) between two comparison pairs (CL144 versus Con and Nultin‐3 versus Con). C) Representative overlapped enriched GO terms of two comparison pairs (CL144 versus Con and Nultin‐3 versus Con). D) Proportion of enriched GO terms analyzed from upregulated and downregulated DEGs of CL144 versus Nutlin‐3 comparison pair (padj<0.05). E) Representative GO terms of up‐regulated DEGs of CL144 versus Nutlin‐3 comparison pair (padj<0.05). F) Volcano plot showing gene profiles of CL144 versus Nutlin‐3 comparison pair. DEGs are pointed by red dots (padj<0.05, │log2FC│> 1.5), and bone regeneration‐related genes are displayed (COL11A1, COL8A2). G) Gene heatmaps of representative GO terms of Ossification (GO:0001503) and Proteasome‐mediated ubiquitin‐dependent protein catabolic process (GO:0043161), FC = fold change. H) Calcium deposition staining (X‐Rhod‐1) of cultured hBMSCs treated with Nutlin‐3 and CL144 under osteogenic differentiation conditions. Images are pseudo‐colored by intensity. I) Quantitative data of calcium deposition images (H), Student's t‐test: *p < 0.05, **p < 0.005, ***p < 0.001, mean with SEM; n = 3. J,K) ARS staining (J) expression level of osteogenic marker genes (K) of hBMSCs by treatment with Nutlin‐3 and CL144 under osteogenic differentiation conditions; ANOVA Bonferroni test: ns = non‐significant, *p < 0.05, **p < 0.01, ***p < 0.001, ****p < 0.0001; mean with SEM; n = 4.
Figure 5
Figure 5
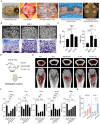
The effects of MDM2‐PROTAC on bone regeneration in preclinical models. A) A process of a vertical onlay graft model on rabbit calvaria. B) Radiographic (upper) and histologic (lower) images of augmented rabbit calvaria bone tissues. C) Quantification of micro‐CT data with parameters of new bone volume (NBV) and new bone area (NBA); ANOVA Bonferroni test: *p < 0.05, ***p < 0.001, ****p < 0.0001; mean with SEM; n = 6. D) Schematic diagram of OVX‐induced osteoporosis model; 4 weeks administration of CL144 or Nutlin‐3 using implanted Alzet pumps in mice induced with osteoporotic conditions through ovariectomy (OVX) surgery. E) The micro‐CT 3D analysis of femur tissues in an OVX‐induced osteoporosis model, following administration of CL144 (0.5 mg kg−1) and Al single‐treatment (0.5 mg kg−1) or co‐treatment condition (0.5 mg kg−1 group); white structure = cortical bone, red structure = trabecular bone, Al = Alendronate. F) The bone formation parameters analysis such as bone volume/tissue volume (BV/TV), trabecular number (Tb.N), trabecular thickness (Tb.Th), and bone mineral density (BMD) following the micro‐CT data analysis, ANOVA Bonferroni test: ns = non‐significant, *p < 0.05, **p <0.005, ****p < 0.0001, Al = Alendronate; mean with SEM; n = 6. G) Compared to the OVX group, relative comparison of bone formation parameters in the CL144, Al single‐treatment group and co‐treatment group; Student's t‐test: ***p < 0.001, ****p < 0.0001; mean with SEM; n = 6; The red dotted line represents the BV/TV value of normal bone (Control), and the blue dotted line represents the Tb.Th value of normal bone (Control).

References

    1. Bolamperti S., Villa I., Rubinacci A., Bone Res. 2022, 10, 48. - PMC - PubMed
    1. Loi F., Cordova L. A., Pajarinen J., Lin T. H., Yao Z., Goodman S. B., Bone 2016, 86, 119. - PMC - PubMed
    1. Soliman H., Theret M., Scott W., Hill L., Underhill T. M., Hinz B., Rossi F. M. V., Cell Stem Cell 2021, 28, 1690. - PubMed
    1. a) James A. W., LaChaud G., Shen J., Asatrian G., Nguyen V., Zhang X., Ting K., Soo C., Tissue Eng. Part B 2016, 22, 284; - PMC - PubMed
    2. b) Pan H. C., Lee S., Ting K., Shen J., Wang C., Nguyen A., Berthiaume E. A., Zara J. N., Turner A. S., H. B. Seim 3rd, Kwak J. H., Zhang X., Soo C., Am. J. Pathol. 2017, 187, 1485. - PMC - PubMed
    1. Nakashima M., Reddi A. H., Nat. Biotechnol. 2003, 21, 1025. - PubMed

LinkOut - more resources