. 2025 May;12(19):e2415459.
doi: 10.1002/advs.202415459. Epub 2025 Mar 24.

Silicon Enhances Functional Mitochondrial Transfer to Improve Neurovascularization in Diabetic Bone Regeneration

Affiliations

Silicon Enhances Functional Mitochondrial Transfer to Improve Neurovascularization in Diabetic Bone Regeneration

Yu-Xuan Ma et al. Adv Sci (Weinh). 2025 May.

Abstract

Diabetes mellitus is a metabolic disorder associated with an increased risk of fractures and delayed fracture healing, leading to a higher prevalence of bone defects. Recent advancements in strategies aim at regulating immune responses and enhancing neurovascularization have not met expectations. This study demonstrates that a silicon-based strategy significantly enhances vascularization and innervation, thereby optimizing the repair of diabetic bone defects. Silicon improves mitochondrial function and modulates mitochondrial fission dynamics in macrophages via the Drp1-Mff signaling pathway. Subsequently, functional mitochondria are transferred from macrophages to endothelial and neuronal cells through microvesicles, providing a protective mechanism for blood vessels and peripheral nerves during early wound healing. On this basis, an optimized strategy combining a silicified collagen scaffold with a Drp1-Fis1 interaction inhibitor is used to further regulate mitochondrial fission in macrophages and enhance the trafficking of functional mitochondria into stressed receptor cells. In diabetic mice with critical-sized calvarial defects, the silicon-based treatment significantly promotes vessel formation, nerve growth, and mineralized tissue development. These findings provide therapeutic insights into the role of silicon in promoting diabetic bone regeneration and highlight the importance of intercellular communication in diabetic conditions.

Keywords: bioactive silicon; diabetic bone defects; macrophages; mitochondrial transfer; neural; vascular.


Conflict of interest statement

The authors declare no conflict of interest.

Figures

Figure 1
Figure 1
Silicon promotes inflammatory response, vascularization, innervation, and mineralization during diabetic bone repair. A) Illustration of silicon release after SCS implantation in diabetic mice with critical‐sized calvarial defects. The ossification, immune response, and neurovascularization were analyzed using micro‐computed tomography and histological examination. B,C) Representative micro‐CT images and quantitative analysis of newly‐formed bone (n = 4). The red‐dotted circle indicates approximately the original defect zone. Scale bar: 500 mm. D,E) Representative stained images and quantification of F4/80+ macrophages within the calvarial defect site (n = 4). Scale bar: 200 µm. F,G) Representative stained images and quantification of CD31+ vessels and TUBB3+ nerves within the calvarial defect site (= 4). Scale bar: 100 µm. H) Schematic showing the diabetic bone regeneration after CS or SCS implantation. SCS triggers an earlier immune response, promotes neurovascular regeneration, and leads to improved outcomes during the repair of diabetic bone defects. CS: collagen scaffold, SCS: silicified collagen scaffolds, BV/TV: bone volume/total volume. Statistical analysis was performed using Student's t‐test. with significance defined as *P < 0.05, **P < 0.01, ***P < 0.001. All illustrations were created using Gallery software and are available for public utilization.
Figure 2
Figure 2
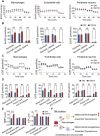
Silicon improves mitochondrial respiration in macrophages, but not in endothelial cells or peripheral neurons under simulated diabetic conditions. A,B) Measurement of EACR, glycolysis, glycolytic capacity, and glycolytic reserve were measured in macrophages, endothelial cells, and neuronal cells, respectively (n = 4). C,D) Measurement of OCR, basal respiration, maximal respiration, spare respiratory capacity, and ATP production were measured in macrophages, endothelial cells, and peripheral neurons, respectively (= 4). E) ATP level and MMP level of various cell types under simulated diabetic conditions, in the absence or presence of silicon (= 6). F) Schematic showing the energy metabolism of various cell types under diabetic conditions with silicon supplement. DM: diabetic condition, DM+Si: diabetic condition with silicon supplement, EACR: extracellular acidification rate., OCR: oxygen consumption rate, ATP: adenosine triphosphate, MMP: mitochondrial membrane potential. Statistical analysis was performed using Student's t‐test. with significance defined as *P < 0.05, **P < 0.01, ***P < 0.001, NS: not significant. All illustrations were created using Gallery software and are available for public utilization.
Figure 3
Figure 3
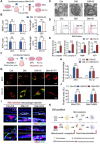
Silicon interacts with macrophages to enhance angiogenesis and nerve regeneration. A) Schematic of the experimental set‐up. B) Quantification of intracellular ATP levels in endothelial progenitor cells (EPC) and neurons (PC‐12) under the indicated treatments (n = 6). C,D) Representative images and quantification of mitochondrial membrane potential in EPC and PC‐12 cells using TMRE intensity (n = 6). Scale bar: 10 µm. E,F) Representative images and quantification of tubular structures formed by EPC and neurite length in PC‐12 cells under the indicated treatments (= 6). Scale bar: 100 µm. G,H) Representative images and quantification of CD31+ vessels and TUBB3+ nerve fibers within the calvarial defect site in macrophage‐depleted diabetic mice (= 4). Scale bar: 20 µm. I) Schematic illustrating the influence of macrophages on endothelial and neuronal cells under diabetic conditions. CM: conditioned medium, Blank: blank control condition, DM: diabetic condition, DM+Si: diabetic condition with silicon supplement. Statistical analysis was performed using Student's t‐test. with significance defined as ***< 0.001, NS: not significant. All illustrations were created using Gallery software and are available for public utilization.
Figure 4
Figure 4
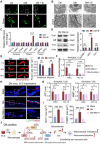
Macrophages transfer mitochondria to endothelial and neuronal cells under simulated diabetic (DM) conditions. A) Schematic showing the experimental set‐up to investigate intercellular communication. B) Quantification of intracellular ATP protection and mitochondrial membrane potential in endothelial progenitor cells (EPC) or PC‐12 under indicated treatments (n = 6). C) Representative TEM pictures of extracellular vesicles and extracellular mitochondria derived from the macrophage‐conditioned medium after DM or DM+Si treatment. Scale bar: 100 nm. D) Macrophages were labeled with MitoTracker. FACS showed that extracellular mitochondria were present in the macrophage‐conditioned medium. E) Mitochondrial respiratory chain complex activity, mitochondrial membrane potential, and ATP content in extracellular mitochondria derived from macrophage under DM or DM+Si condition (n = 4). F) Schematic showing the experimental set‐up to investigate intercellular mitochondria transfer. G,H) Representative images and quantification of exogenous (green, from macrophages) and endogenous (red) mitochondrial signals observed in EPC and PC‐12 cells (= 6). Scale bar: 10 µm. I,J) Representative images and quantification of Mito‐labeled macrophage (red) co‐localizing with CD31+ blood vessels or TUBB3+ nerve fibers (green) within the calvarial defect site (n = 4). Scale bar: 20 µm. K) Schematic showing that macrophages transfer mitochondria in different functional states to endothelial and neuronal cells. CM: conditioned medium, DM: diabetic condition, DM+Si: diabetic condition with silicon supplement, DM+Si+Fil: diabetic condition with silicon supplement, where a 0.2 µm filter was employed. Statistical analysis for B, E was performed using Student's t‐test, with significance defined as NS: not significant. Statistical analysis for H, J was performed using one‐way ANOVA, with significance defined as NS: not significant. All illustrations were created using Gallery software and are available for public utilization.
Figure 5
Figure 5
Silicon promotes functional mitochondrial production by altering mitochondrial fission under simulated diabetic (DM) conditions. A) Representative images of mitochondrial morphology in RAW264.7 cells under different culture conditions. Scale bar: 1 µm. B) Representative TEM images of mitochondrial morphology in RAW264.7 cells under different culture conditions. Scale bar: 100 nm. C) Quantitative analysis of gene expression levels related to mitochondrial biogenesis, fusion, and fission in RAW264.7 cells under DM or DM+Si conditions (= 3). D) Analysis of mitochondrial fission protein expression in RAW264.7 cells under DM or DM+Si conditions (n = 3). E) Representative images and quantification of mitochondrial fission of macrophages under different culture conditions. Peripheral mitochondrial fission (less than 25% from a tip) and midzone fission (within the central 50%) were analyzed. Scale bar: 50 nm. F) Mitochondrial transfer from RAW264.7 to EPC and PC‐12 cells in different treatment groups were analyzed with flow cytometry (n = 3). G) Mitochondria function in EPC and PC‐12 cells in different treatment groups were analyzed by MMP and ATP levels (n = 6). H,I) Representative stained images and quantification of CD31+ vessels and TUBB3+ nerve within the calvarial defect site in different treatment groups (n = 4). Scale bar: 20 µm. J) Schematic showing silicon altering mitochondrial fission in macrophages to produce functional mitochondria. CM: conditioned medium, DM: diabetic condition, DM+Si: diabetic condition with silicon supplement, Mø: macrophages. Statistical analysis for C, D, E was performed using Student's t‐test, with significance defined as **< 0.01, ***< 0.001, NS: not significant. Statistical analysis for F, G, I was performed using one‐way ANOVA, with significance defined as *P < 0.05, **P < 0.01, ***P < 0.001, NS: not significant. All illustrations were created using Gallery software and are available for public utilization.
Figure 6
Figure 6
Combined Si and P110 therapy promotes diabetic bone regeneration. A) Schematic showing combination of Si and P110 altering mitochondrial fission to produce functional mitochondria. B) JC‐10 staining to determine mitochondrial membrane potential in RAW264.7 cells. Scale bar: 100 µm. C) Mitochondrion‐specific superoxide was detected by MitoSOX red staining in RAW264.7 cells. Scale bar: 10 µm. D) RAW264.7 cells were fractionated into membrane fractions, which were analyzed by Western blotting using designated antibodies (n = 3). E) Mitochondrial transfer from RAW264.7 to EPC and PC‐12 cells was analyzed in different groups using flow cytometry (n = 3). F) Mitochondria function in EPC and PC‐12 cells was analyzed in different groups by MMP and ATP levels (n = 6). G,H) Representative stained images and quantification of CD31+ vessels and TUBB3+ nerve within the calvarial defect site in different groups (n = 4). Scale bar: 20 µm. I,J) Representative micro‐CT images and quantitative analysis of newly formed bone in different groups (n = 4). Scale bar: 500 µm. CM: conditioned medium. Statistical analysis was performed using one‐way ANOVA, with significance defined as **P < 0.01, ***P < 0.001. All illustrations were created using Gallery software and are available for public utilization.

References

    1. Zheng Y., Ley S. H., Hu F. B., Nat. Rev. Endocrinol. 2018, 14, 88. - PubMed
    1. Hofbauer L. C., Busse B., Eastell R., Lancet Diabetes Endocrinol. 2022, 10, 207. - PubMed
    1. Napoli N., Chandran M., Pierroz D. D., Nat. Rev. Endocrinol. 2017, 13, 208. - PubMed
    1. Chen Y., Zhou Y., Lin J., Zhang S., Front. Endocrinol. 2022, 13, 861878. - PMC - PubMed
    1. Pirola L., Balcerczyk A., Okabe J., El‐Osta A., Nat. Rev. Endocrinol. 2010, 6, 665. - PubMed

LinkOut - more resources