. 2025 May;12(19):e2416401.
doi: 10.1002/advs.202416401. Epub 2025 Mar 24.

ISG15 Enhances the Activity of γ-Glutamate Cysteine Ligase to Suppress Apoptosis in High Fat Diet-Promoted Hepatocellular Carcinoma

Affiliations

ISG15 Enhances the Activity of γ-Glutamate Cysteine Ligase to Suppress Apoptosis in High Fat Diet-Promoted Hepatocellular Carcinoma

Xinran Liu et al. Adv Sci (Weinh). 2025 May.

Abstract

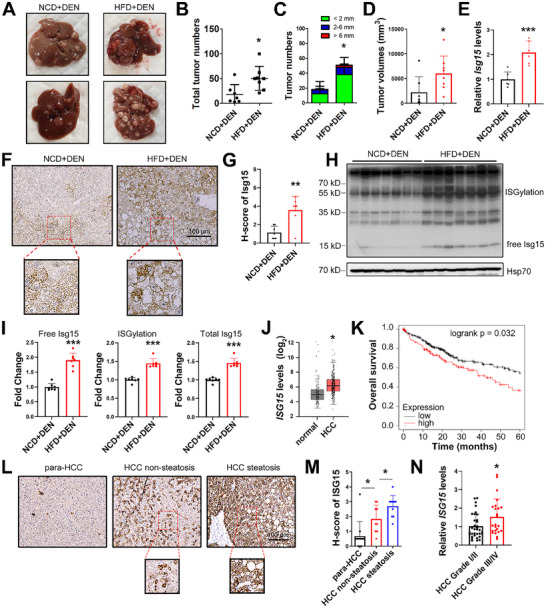
Obesity is a leading risk factor for development of hepatocellular carcinoma (HCC). High-fat intake produces cytotoxic effects in liver cells, such as excessive reactive oxygen species (ROS) accumulation and apoptosis. How HCC cells regulate ROS level and escape the cytotoxic effects of high fat diet (HFD) stress remains unclear. Herein, this work reports a critical anti-ROS/apoptotic role of the ubiquitin-like protein interferon stimulated gene 15 (ISG15) in HFD-promoted HCC. In mouse models and clinical HCC samples, upregulation of ISG15 is associated with hepatic steatosis. Notably, upregulated ISG15 elevates cellular glutathione levels, which subsequently reduces ROS accumulation and confers resistance to apoptosis in HCC cells. In diethylnitrosamine-induced HCC mouse model, HFD-feeding promotes HCC progression in wildtype mice, while tumor growth is significantly suppressed accompanied by apoptosis of HCC cells in Isg15-KO mice. Mechanistically, ISG15 promotes the activity of γ-glutamate cysteine ligase (γ-GCL), a rate-limiting heterodimeric holoenzyme of glutathione synthesis consisting of glutamate-cysteine ligase catalytic subunit (GCLC) and glutamate-cysteine ligase modifier subunit (GCLM). Independent of ISGylation, ISG15 forms an ISG15/GCLM/GCLC complex that promotes GCLM-GCLC interaction, increases glutathione generation and inhibits HFD-induced apoptosis in HCC cells. Together, an anti-apoptotic ISG15-γ-GCL-glutothione axis is suggested in HFD-promoted HCC.

Keywords: glutathione; hepatocellular carcinoma; high fat diet; interferon stimulated gene 15; reactive oxygen species; γ‐glutamate cysteine ligase.


Conflict of interest statement

The authors declare no conflict of interest.

Figures

Figure 1
Figure 1
ISG15 is upregulated in HCC under fat challenge. A) Representative liver images for the indicated groups. B) Total tumor numbers. C) Numbers of tumors with different diameters. D) Quantification of total tumor volumes. E) The mRNA levels of Isg15 in mice HCC tissues. F,G) Representative images (F) and H‐score quantification (G) of Isg15 IHC staining in murine HCC tissues. H,I) Western blots (H) and the relative integrated density values (I) of free, conjugated forms and total Isg15 in murine HCC tissues. J) mRNA levels of ISG15 in HCC and para‐HCC tissues. Data from GEPIA. K) Over‐all survival rates of HCC patients with high ISG15 expression levels (red) and low levels (black). Data from UALCAN. L,M) Representative IHC images (L) and H‐score quantification (M) of ISG15 in human HCC clinical samples. N) The mRNA levels of ISG15 in clinical HCC samples of indicated grades. RNA‐seq data was from GSE195952. Data shown as mean ± SD. *p < 0.05; **p < 0.01; ***p < 0.001.
Figure 2
Figure 2
PA transcriptionally upregulates ISG15 through HMGA1. A) mRNA levels of Irf3 in murine HCC tissues. B,C) Western blots (B) and the relative integrated density values (C) of Hmga1, Irf3 and phosphorylated Irf3 in murine HCC tissues. D) Potential transcription factor (TF) candidates for Isg15 under HFD challenge screened through JASPAR, TFDB and hTFtarget databases. Ten candidates were found in RNA‐seq data to detect differently expressed genes in HFD versus NCD samples, and Hmga1 was identified. E) mRNA levels of Hmga1 in murine HCC tissues. F) Western blots of endogenous ISG15 in Hep3B and HepG2 cells at 24 h after transfection of the plasmid expressing Flag‐HMGA1. G) Western blots of ISG15 (top) and HMGA1 (bottom) in Hep3B cells under PA (100 µM) or IFN‐γ treatments for 24 h. H) mRNA levels of ISG15 and HMGA1 in Hep3B and HepG2 cells under PA (100 µM) or IFN‐γ treatment for 24 h. Compared with the control group, the ISG15 levels were significantly elevated both by PA and IFN‐γ treatments; whereas the HMGA1 level was only increased in the PA‐treated group. I) mRNA levels of HMGA1 in HMGA1‐KO Hep3B cells. J) Western blots of HMGA1 in HMGA1‐KO Hep3B cells. K) Western blots of ISG15 in HMGA1‐WT and HMGA1‐KO cells treated with 100 µM of PA for 24 h. L) mRNA levels of ISG15 in HMGA1‐WT and HMGA1‐KO cells treated with 100 µM of PA for 24 h. M) Overexpression of HMGA1 (plasmid transfection gradient: 0, 0.1, 0.2, 0.4, 0.8 µg) enhanced the luciferase activity driven by the ISG15 promoter (2 kb upstream of ISG15) in Hep3B cells. N) ChIP analysis of HMGA1 occupancy on the different segments on ISG15 promoter in Hep3B cells with or without 100 µM of PA treatment. O) Deletion of indicated ISG15 promoter fragments attenuated the luciferase activity induced by HMGA1 in Hep3B cells. Compared with the WT group, in ISG15 promoter constructs with these two sites deleted, HIGMA1‐induced promoter activity was significantly attenuated. Data shown as mean ± SD. *p < 0.05; **p < 0.01; ***p < 0.001.
Figure 3
Figure 3
ISG15 abrogates fat stress induced cytotoxicity in HCC cells. A) Viability of ISG15‐WT/KO Hep3B and HepG2 cells in PA‐free condition determined by MTT analysis. B) Viability of ISG15‐WT/KO and ISG15‐rescued Hep3B and HepG2 cells treated with 300 µM of PA. C) Colony formation of ISG15‐WT/KO and ISG15‐rescued Hep3B and HepG2 cells under 300 µM of PA treatment for 72 h (left), and quantification results (right). D) MDA contents of ISG15‐WT/KO and ISG15‐rescued Hep3B and HepG2 cells with or without 300 µM of PA treatment. E) Western blots and the quantitative ratio of the cleaved to full‐length of Caspase‐9/Caspase‐8 in ISG15‐WT/KO Hep3B and HepG2 cells under 300 µM of PA treatment for 48 h. F) Western blots and the quantitative ratio of the cleaved to full‐length of Caspase‐8 in ISG15‐KO and ISG15‐rescued Hep3B and HepG2 cells under 300 µM of PA treatment for 48 h. G) Apoptosis of ISG15‐WT/KO and ISG15‐rescued Hep3B and HepG2 cells under 300 µM of PA treatment for 48 h determined by FACS analysis. Data shown as mean ± SD. *p < 0.05; **p < 0.01; ***p < 0.001.
Figure 4
Figure 4
ISG15 inhibits apoptosis of HCC cells by increasing glutathione and reducing ROS. A) ROS levels of ISG15‐WT/KO Hep3B and HepG2 cells under 300 µM of PA treatments for 24 h determined by FACS analysis. B) Representative DCFH‐DA staining (Green fluorescence) images for ROS of ISG15‐WT/KO and ISG15‐rescued Hep3B cells treated with PA for 24 h. Cell nuclei were stained with Hoechst (blue fluorescence). C) Quantification results of ROS in Hep3B (left) and HepG2 (right) cells. D) Viability by MTT analysis of ISG15‐WT/KO Hep3B (left) and HepG2 (right) cells treated with PA (300 µM), or pre‐treated with glutathione (10 mM) or NAC (10 mM) for 12 h before PA treatment. (E) Total glutathione levels in ISG15‐WT/KO and ISG15‐rescued Hep3B (left) and HepG2 (right) cells treated with 300 µM of PA for 24 h. F) γ‐glutamate cysteine ligase activities in ISG15‐WT/KO and ISG15‐rescued Hep3B (left) and HepG2 (right) cells under 300 µM of PA treatment for 24 h. G) Total glutathione levels in two ISG15 overexpressing UBA7‐KO Hep3B cell lines (KO 1# and KO 2#) under PA treatments for 24 h. H) γ‐glutamate cysteine ligase activities in two ISG15 overexpressing UBA7‐KO Hep3B cell lines (KO 1# and KO 2#) under PA treatments for 24 h. I) Total glutathione levels in Hep3B and HepG2 cells overexpressing ISG15 mutants under 300 µM of PA treatments for 24 h. Compared with the control group, overexpressing ISG15 mutants increased total cellular glutathione levels with or without PA treatments. J) Co‐immunoprecipitation of GCLM and ISG15. HEK293T cells were co‐transfected with Flag‐GCLM and/or Myc‐ISG15‐GG/AA as indicated, anti‐Flag immunoprecipitates (top) and total lysates (bottom) were subjected to immunoblot with anti‐Flag antibody to reveal foreign GCLM, and anti‐Myc antibody to reveal foreign ISG15. K) Co‐immunoprecipitation of endogenous Gclm and Isg15 in mouse HCC tissues. Anti‐Gclm immunoprecipitate and total lysate of mouse tissues were subjected to immunoblot with anti‐Gclm and anti‐Isg15 antibodies. Data shown as mean ± SD. *p < 0.05; **p < 0.01; ***p < 0.001.
Figure 5
Figure 5
ISG15 upregulates glutathione production by promoting the GCLC‐GCLM interaction. A) Co‐immunoprecipitation of GCLM/GCLC and ISG15. ISG15‐WT/KO Hep3B (left) and HepG2 (right) cells were treated with PA as indicated, anti‐GCLC immune‐precipitates (top) and total lysates (bottom) were subjected to immunoblot with GCLC, GCLM and ISG15 antibodies. 100 µM of PA was added 24 h before cell lysis. B) ISG15‐KO Hep3B (left) and HepG2 (right) cells were co‐transfected with HA‐ISG15‐GG/AA as indicated. Anti‐GCLC immunoprecipitates (top) and total lysates (bottom) were subjected to immunoblot with GCLC, GCLM, and ISG15 antibodies. C) Representative structures of ISG15 (green) and GCLM (blue), and residues on the interaction interface are as labeled; and the primary sequences of ISG15‐Δ85‐93 and ISG15‐84AAA. D) Co‐immunoprecipitation of GCLM and indicated ISG15 constructs. HEK293T cells were co‐transfected with Flag‐GCLM and HA‐ISG15 mutants as indicated. Anti‐Flag immunoprecipitates (top) and total lysates (bottom) were subjected to immunoblot with anti‐Flag and anti‐HA antibodies. E,F) Co‐immunoprecipitation of GCLC/GCLM and indicated ISG15 constructs in ISG15‐KO (E) and dual knockout of ISG15 and UBA7 Hep3B cells (F). Cells were co‐transfected with HA‐ISG15 mutants as indicated. Anti‐GCLC immunoprecipitates (top) and total lysates (bottom) were subjected to immunoblot with anti‐GCLM and anti‐GCLC antibodies. G) γ‐glutamate cysteine ligase activities in ISG15‐KO Hep3B (left) and HepG2 (right) cells expressing HA‐ISG15 mutants with or without 300 µM of PA treatment. H) Total glutathione levels in ISG15‐KO Hep3B (left) and HepG2 (right) cells expressing HA‐ISG15 mutants with or without 300 µM of PA treatment. I) Viability of ISG15‐WT/KO Hep3B (left) and HepG2 (right) cells overexpressing HA‐ISG15 mutants with 300 µM of PA treatment for 48 h determined by MTT assay. Data shown as mean ± SD. *p < 0.05, **p < 0.01, ***p < 0.001.
Figure 6
Figure 6
Ablation of Isg15 inhibits HCC progression in HFD‐fed mice. A) Experiment flowchart of DEN‐induced HCC in HFD‐fed mice. B) Representative liver images for each group. Arrows indicate tumors. C) Quantification results of total tumor volumes and number of large tumors. D) Serum AST and ALT levels of mice from indicated groups. E,F) Representative images of TUNEL staining (E) and quantification results (F) in mice HCC samples. G) Representative H&E staining in mice HCC samples. Dotted lines indicate tumor outlines; arrows indicate Councilman bodies (apoptotic hepatic cells). H) Quantification results of apoptotic cells in mice HCC samples. I) γ‐glutamate cysteine ligase activities in mice HCC samples. J) Total glutathione levels in mice HCC samples. K) MDA contents in mice HCC samples. L) Co‐immunoprecipitation of Gclc/Gclm in mouse HCC samples. HCC samples were subjected to immunoblot with anti‐Gclm, anti‐Gclc and anti‐Isg15 antibodies. Equal amounts of each protein sample from the same group were normalized and combined into 4 groups, and anti‐Gclc immunoprecipitates and total lysates were subjected to immunoblot with anti‐Gclm and anti‐Gclc antibodies. M) Schematic model of pathways leading to development of HCC. High‐fat intake contributes to HCC development; however, fat accumulation also brings about cytotoxic effects such as excessive ROS, which leads to apoptosis and prevents HCC progression. HCC cells under high‐fat environment constrain harmful ROS by enhancing glutathione synthesis though upregulating ISG15. In this process, upregulated HMGA1 enhances ISG15 transcription, upregulated ISG15 subsequently noncovalently binds with GCLM and increases the GCLM‐GCLC interaction to form an ISG15/GCLM/GCLC complex, which has increased γ‐GCL enzymatic activity that promotes glutathione synthesis to protect HCC cells from ROS‐induced apoptosis. Data shown as mean ± SD. *p < 0.05; **p < 0.01; ***p < 0.001; # 0.05 < p < 0.07.

Similar articles

References

    1. Sung H., Ferlay J., Siegel R. L., Laversanne M., Soerjomataram I., Jemal A., Bray F., CA Cancer J. Clin. 2021, 73 Suppl 1, 209. - PubMed
    1. McGlynn K. A., Petrick J. L., El‐Serag H. B., Hepatology 2021, 73, 4. - PMC - PubMed
    1. Lee Y. T., Wang J. J., Luu M., Tseng H. R., Rich N. E., Lu S. C., Nissen N. N., Noureddin M., Singal A. G., Yang J. D., Hepatology 2021, 74, 1384. - PubMed
    1. Yang F., Hilakivi‐Clarke L., Shaha A., Wang Y., Wang X., Deng Y., Lai J., Kang N., Hepatology 2023, 78, 1602. - PMC - PubMed
    1. Park E. J., Lee J. H., Yu G. Y., He G., Ali S. R., Holzer R. G., Osterreicher C. H., Takahashi H., Karin M., Cell 2010, 140, 197. - PMC - PubMed

MeSH terms

LinkOut - more resources