. 2025 Jun 16;85(12):2218-2233.
doi: 10.1158/0008-5472.CAN-24-4317.

Age-Associated Modulation of TREM1/2-Expressing Macrophages Promotes Melanoma Progression and Metastasis

Affiliations

Age-Associated Modulation of TREM1/2-Expressing Macrophages Promotes Melanoma Progression and Metastasis

Marzia Scortegagna et al. Cancer Res. .

Abstract

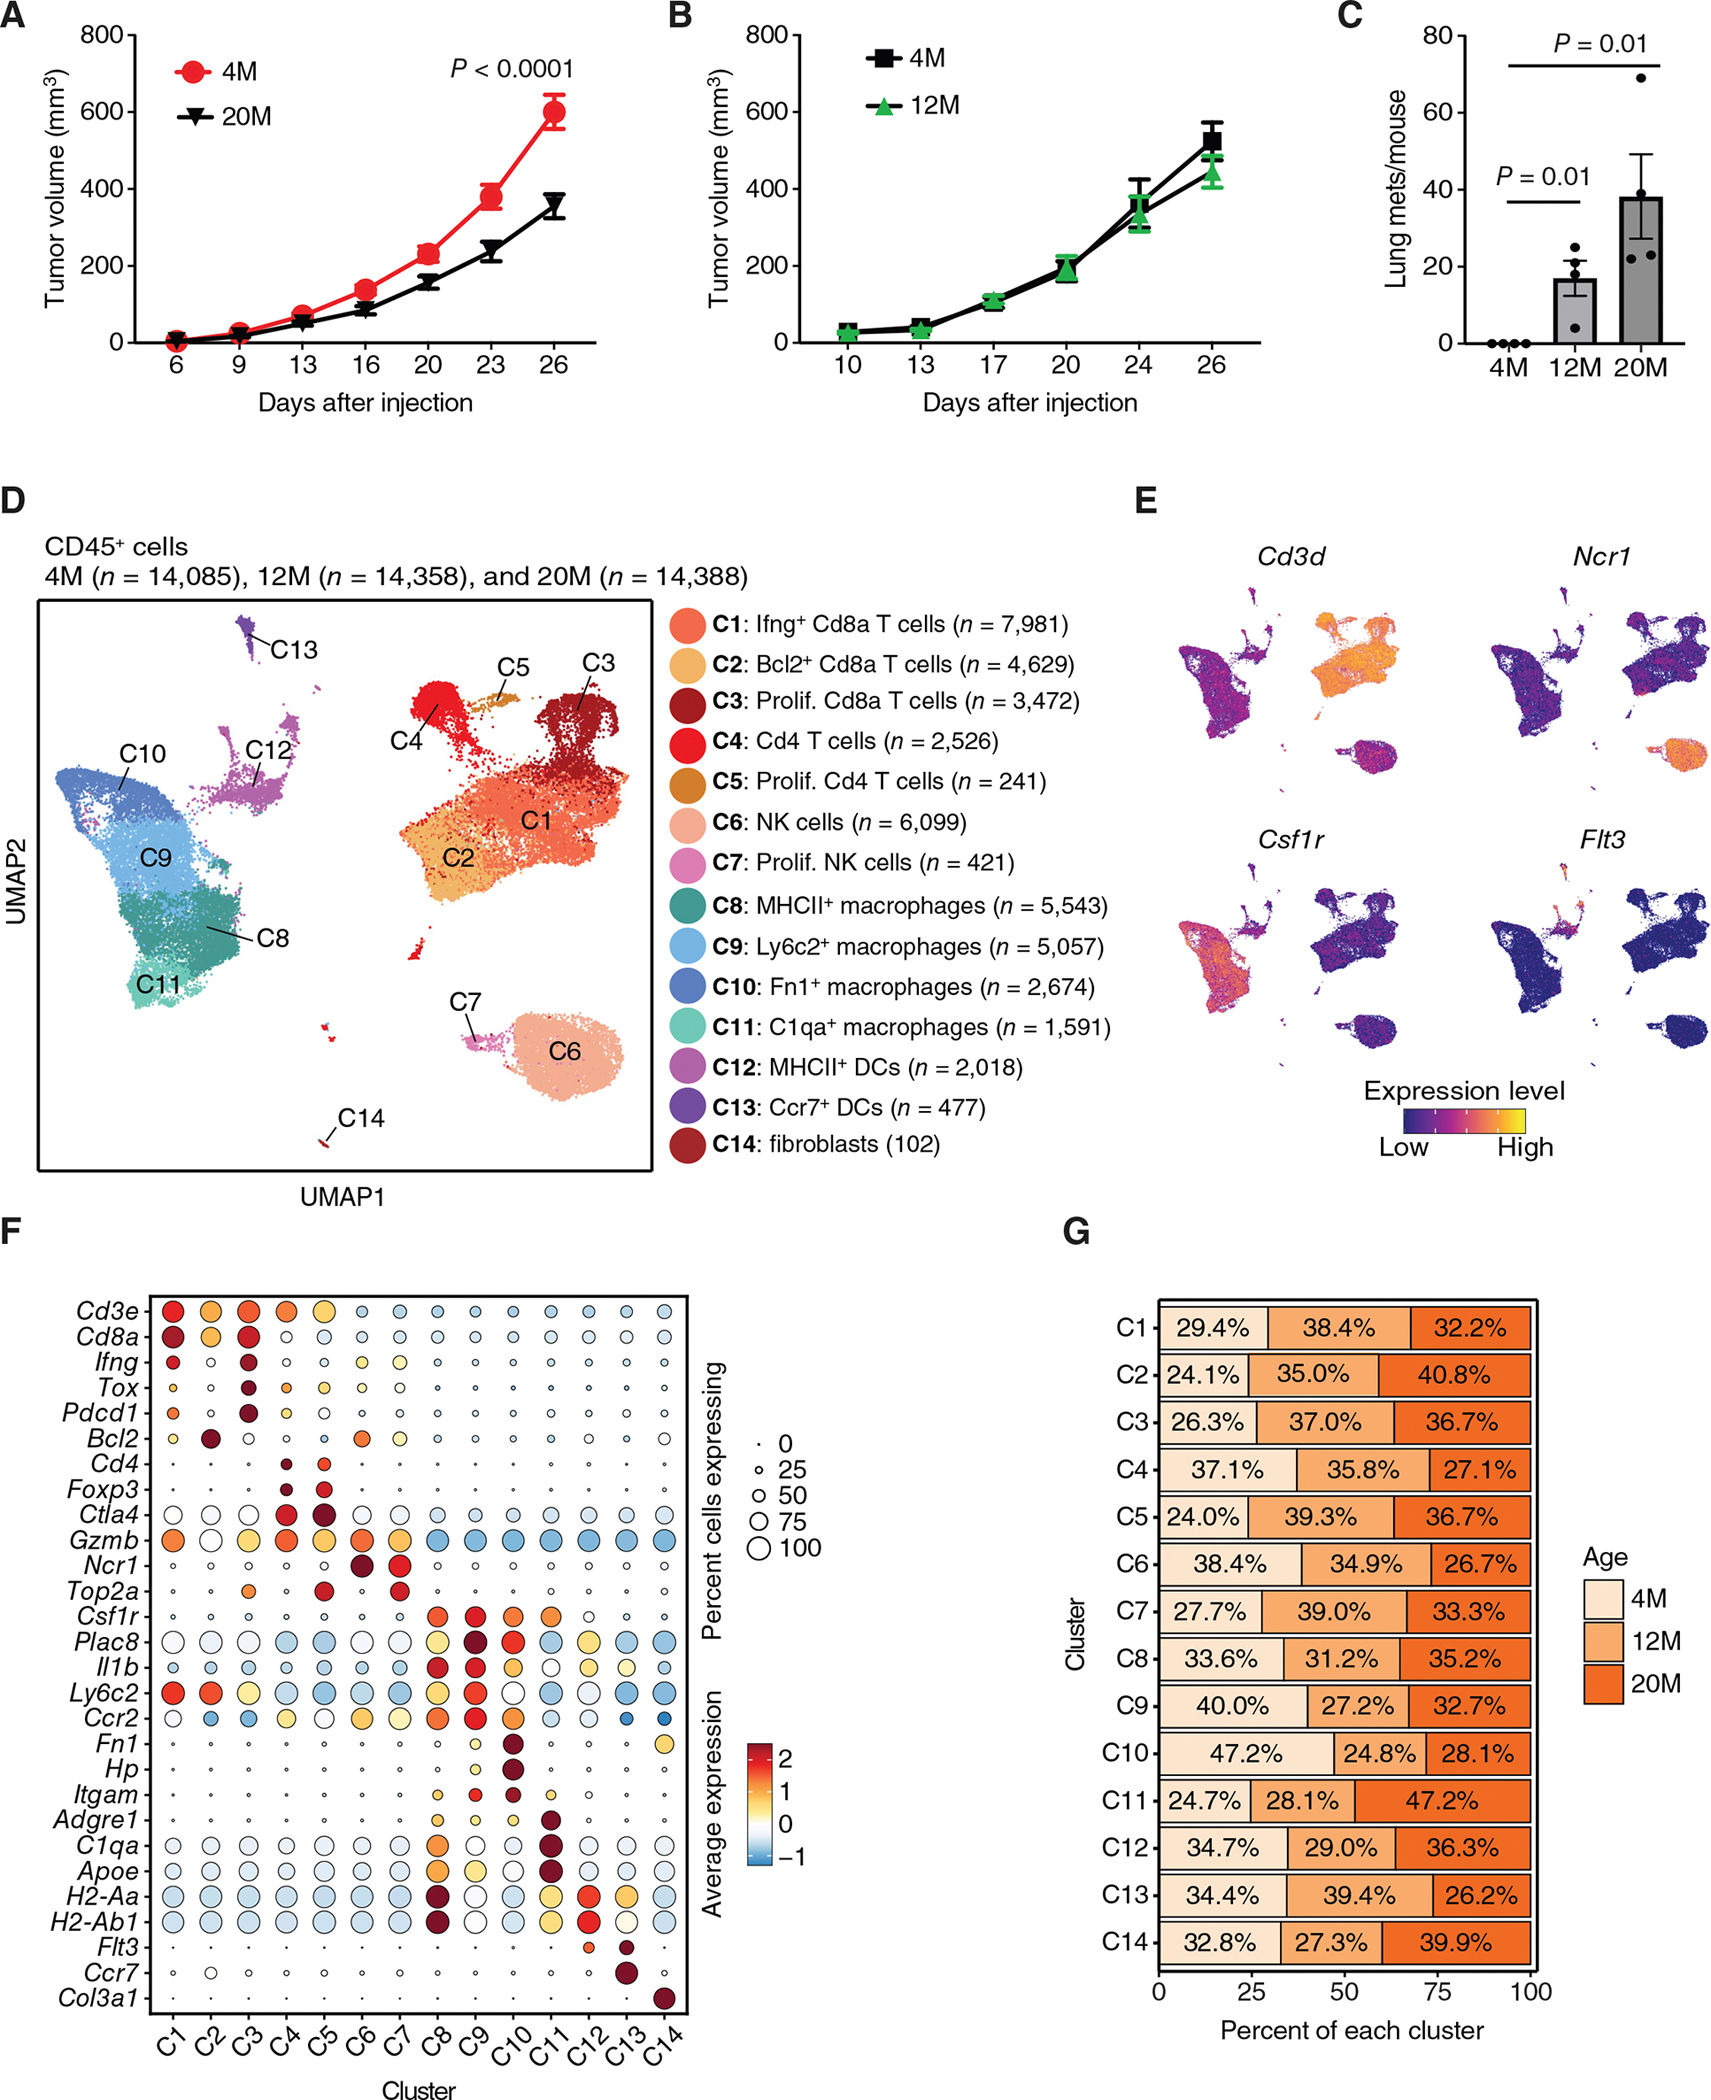
Aging is a known risk factor for melanoma, yet mechanisms underlying melanoma progression and metastasis in older populations remain largely unexplored. Aging might alter phenotypes of cells in the melanoma microenvironment, selecting for populations that support metastatic progression. In this study, we have demonstrated that age engenders the development of an immunosuppressive tumor microenvironment, which is linked to phenotypes associated with melanoma metastasis. Among cellular populations enriched by aging were macrophages with a tolerogenic phenotype expressing TREM2 and dysfunctional CD8+ T cells with an exhausted phenotype, whereas macrophages with a profibrotic phenotype expressing TREM1 were depleted. Notably, TREM1 inhibition decreased melanoma growth in young but not in old mice, whereas TREM2 inhibition prevented lung metastasis in aged mice. These data identify age-related targets associated with melanoma metastasis and may guide age-dependent immunotherapeutic strategies.

Significance: TREM2 is elevated in melanoma-associated macrophages of aged mice and humans and can be inhibited to block melanoma metastasis, highlighting the role of the microenvironment in promoting aging-related metastasis.


Conflict of interest statement

Authors’ Disclosures

P.D. Adams reports grants from Sanford Burnham Prebys Medical Discovery Institute during the conduct of the study. K. Vuori and Z.A. Ronai report grants from NIH/NCI during the conduct of the study. Z.A. Ronai reports nonfinancial support from Pangea Biomed outside the submitted work. No disclosures were reported by the other authors.

Figures

Figure 1.
Figure 1.
Aging promotes lung metastasis and alters the composition of immune cells in melanoma tumors. A and B, YUMM1.7 melanoma cells (500,000) were injected subcutaneously into the flank of either 4-month-old (4M) and 20-month-old (20M; A) or 4- and 12-month-old mice (B), and tumor growth (volume) was measured over time. n = 10 for 4 month and n = 8 for 20 month in A; n = 6 for 4 month and n = 5 for 12 month in B. C, YUMM1.7 melanoma cells (500,000) were injected subcutaneously into the flank of 4-, 12-, and 20-month-old mice, and after 22 days, the lungs were collected and processed to obtain five serial sections per lung and quantitate metastasis (mets), which were analyzed by IHC of S100, a marker of melanoma cells, to quantify S100-positive colonies (more than 10 S100+ cells per lesion). N = 4 for each group. D, CD45+ cells were sorted by flow cytometry from melanoma tumors of 4-, 12-, and 20-month-old mice, and scRNA-seq was performed. Integrated Uniform Manifold Approximation and Projection (UMAP) plot of CD45+ cells from melanoma tumors (seven tumors/group) collected 14 days after inoculation of YUMM1.7 cells showing different immune cell clusters. Immune cell types identified based on the expression of specific cell markers are labeled. DC, dendritic cells; Prolif., proliferative. E, UMAP plots showing marker genes’ expression used to identify immune cell populations. F, Dot plots showing scaled expression of marker genes used to identify specific immune cell populations. G, Bar graph showing the percentages of various immune cells for each cluster from 4-, 12-, and 20-month-old mice. Data in A–C are presented as mean ± SEM. Data in A were analyzed by using two-way ANOVA. Data in C were analyzed by using the unpaired t test.
Figure 2.
Figure 2.
Aging is conducive to the establishment of tolerogenic macrophages in melanoma. Csfr1+ cells [clusters C8–C11 from global Uniform Manifold Approximation and Projection (UMAP) in Fig. 1D] from scRNA-seq analysis of CD45+ cells were reclustered to obtain higher resolution clustering of myeloid cells. A, Integrated UMAP plot of myeloid cells from tumors of 4- (n = 5,473 cells), 12- (n = 4,244 cells), and 20-month (M)-old mice (n = 5,148 cells) showing nine subclusters. Mac, macrophages; Prolif., proliferative. B, Dot plots showing scaled expression of marker genes used to identify myeloid cell subclusters. C, Bar graph showing the percentages of various myeloid cell subclusters for each cluster from 4-, 12-, and 20-month-old mice. D, Dot plots showing scaled expression of indicated genes used to identify specific functions. ECM, extracellular matrix. E, Frequencies of CD11b+ F480low among CD11b+ cells from CD45+ cells of tumors from 4- and 20-month-old. F, Frequencies of TREM1+ among CD11b+ F480low cells and representative flow cytometry plots showing TREM1+ expression by a gated subpopulation (CD11b+ cells) of CD45.2+ cells from 4- and 20-month-old mice. G, Frequencies of F480+ among CD45+ cells in tumors from 4- and 20-month-old mice. H, Frequencies of TREM2+ among F480+ cells and representative flow cytometry plots showing TREM2+ expression by a gated subpopulation (F480+ cells) of CD45.2+ cells from 4- and 20-month-old mice. n = 7 for 4 month and n = 6 for 20 month for EH. Data in DH were analyzed by using the unpaired t test. C, control.
Figure 3.
Figure 3.
Tumors in aging mice show increases in a subpopulation of exhausted Gzmk-positive CD8+ T cells. CD8+ cells [clusters C1–C3 from global Uniform Manifold Approximation and Projection (UMAP) in Fig. 1D] from scRNA-seq analysis of CD45+ cells were reclustered to obtain higher resolution clustering of CD8+ cells. A, Integrated UMAP plot of CD8+ cells from tumors of 4- (n = 4,312 cells), 12- mice (n = 5,999 cells), and 20-month (M)-old mice (n = 5,771 cells) showing 12 distinct clusters. B, Dot plots showing scaled expression of marker genes used to identify CD8+ cell subclusters. C, Bar graph showing the percentages of various subclusters of CD8+ cells for each cluster from 4-, 12-, and 20-month-old mice. D and E, Violin plots comparing the expression of specific genes in CD8+ cell subclusters analyzed from 4-, 12-, and 20-month-old mice. F, Frequencies of CD4+ or CD8+ among CD45+ cells of tumors from 4- and 20-month-old mice. G and H, Frequencies of IFNγ+ (G) and GZMB+ (H) among CD8+ cells in tumors from 4- and 20-month-old mice. I, Representative flow cytometry plots showing GZMB+ expression by a gated subpopulation (CD8+ cells) of CD45.2+ cells from 4- and 20-month-old mice. n = 7 for 4 month and n = 6 for 20 month for FH. Data in FH were analyzed by using the unpaired t test. Statistical significance in D and E is reported for 20 month versus 4 month, computed using the FindMarkers function in Seurat.
Figure 4.
Figure 4.
Exhausted CD8+ T cells from aged patients with melanoma show increased GZMK expression. Immune cell clusters from scRNA-seq analysis of samples from patients with melanoma (GSE120575) are stratified by age (≤60 versus ≥70 years). A, Integrated Uniform Manifold Approximation and Projection (UMAP) plot of CD45+ cells from patients with melanoma showing 12 distinct clusters. Immune cell types identified using the expression of specific cell markers are labeled. Mac, macrophages. B, UMAP plots showing the expression of specific genes used to identify immune cell populations. C, Dot plots showing scaled expression of marker genes used to identify immune cell populations. D, Bar graph showing the percentage of various immune cells for each cluster based on the analysis of patients with melanoma in indicated age groups. E, Violin plots comparing pretherapy expression of GZMK in each immune cell cluster based on the analysis of patients with melanoma in indicated age groups. Statistical significance is reported for old (≥70 years) versus young (≤60 years), computed using the FindMarkers function in Seurat.
Figure 5.
Figure 5.
Immunogenic profiles exhibited by macrophages from aging mice are conserved in aging patients with melanoma. Myeloid cell clusters [H10 and H11 from global Uniform Manifold Approximation and Projection (UMAP) in Fig. 4A] from human patient scRNA-seq analysis of CD45+ cells that were reclustered to obtain higher resolution clustering of myeloid cells. A, The integrated UMAP plot of myeloid cells from patients with melanoma of ages <60 years (n = 279 cells), >60 years, <70 years (n = 855 cells), and >70 years (n = 292 cells) showing nine distinct clusters. DC, dendritic cells; Mac, macrophages. B, Dot plots showing scaled expression of marker genes used to identify specific myeloid cell subclusters. C, Bar graph showing the percentage of various subclusters of macrophages from patients with melanoma of ages ≤60 and ≥70 years. D, Violin plots comparing inflammatory and tolerogenic signature score in each macrophage cluster (only clusters represented in patients with melanoma of ages ≤60 and ≥70 years are shown).
Figure 6.
Figure 6.
Function of TREM1 and TREM2 in age-associated melanoma progression and metastasis. A and B, YUMM1.7 melanoma cells (500,000) were injected subcutaneously into the flanks of 4- (young) and 20-month (M)-old mice (old). Four days later, mice were injected intraperitoneally with either TREM1 inhibitor VJDT or vehicle (control; A), and injections were repeated every other day until day 20. B, A separate group of melanoma-bearing mice that were treated with anti-TREM2 antibody starting at day 5 after melanoma cell injection and repeated every 3 days for a total of four treatments. Isotype control served as the control (B). n = 4 for 4 month control-treated mice, n = 5 for 4 month TREM1-treated mice, and n = 4 for 20 month control-treated mice in A; n = 8 for 4 month control-treated mice, n = 5 for 4 month TREM2-treated mice, n = 7 for 20 month control-treated mice, and n = 5 for 20 month TREM2-treated mice in B. C, Representative H&E staining of lung tissues from 20 month melanoma tumor–bearing mice treated either with isotype control (left) or anti-TREM2 antibody (right). Lung tissues were analyzed 22 days after melanoma cell injection. D, Quantification of lung metastases (mets) after treatment of mice with control or anti-TREM2 antibody as described in B. Tissues were subjected to IHC staining for S100 to detect metastatic melanoma cells (more than ten S100+ cells per lesion). n = 5 for each group. Scale bar, 300 μm. E, Frequencies of CD206+ and MHCI+ among CD11b+ and F480+ cells, and expression of CD11c+ cells on F480+ cells of tumors from 4- and 20-month-old mice treated with isotype control or anti-TREM2 antibodies. F, Frequencies of CD4+ and CD8+ among CD45.2+ cells, and expression of CD44+ cells on CD4+ or CD8+ cells of tumors from 4- and 20-month-old mice treated with isotype control or anti-TREM2 antibodies. n = 8 for 4 month control-treated mice, n = 4 for 4 month TREM2-treated mice, n = 7 for 20 month control-treated mice, and n = 5 for 20 month TREM2-treated mice in E and F. Data in A, B, and D–F are presented as mean ± SEM. Data in A were analyzed by using two-way ANOVA. Data in D–F were analyzed by using the unpaired t test and compared with controls of the same age group. MFI, mean fluorescent intensity.

Update of

References

    1. Tsai S, Balch C, Lange J. Epidemiology and treatment of melanoma in elderly patients. Nat Rev Clin Oncol 2010;7:148–52. - PubMed
    1. Thompson JF, Williams GJ. The effect of age on melanoma incidence and prognosis. Aging (Albany NY) 2023;15:7857–9. - PMC - PubMed
    1. Fane M, Weeraratna AT. Normal aging and its role in cancer metastasis. Cold Spring Harb Perspect Med 2020;10:a037341. - PMC - PubMed
    1. Siegel RL, Miller KD, Jemal A. Cancer statistics, 2018. CA Cancer J Clin 2018;68:7–30. - PubMed
    1. Hegde UP, Grant-Kels JM. Metastatic melanoma in the older patient: special considerations. Clin Dermatol 2013;31:311–6. - PubMed

MeSH terms