. 2025 Apr;122(13):e2422172122.
doi: 10.1073/pnas.2422172122. Epub 2025 Mar 24.

Central TYK2 inhibition identifies TYK2 as a key neuroimmune modulator

Affiliations

Central TYK2 inhibition identifies TYK2 as a key neuroimmune modulator

Tyler P Molitor et al. Proc Natl Acad Sci U S A. 2025 Apr.

Abstract

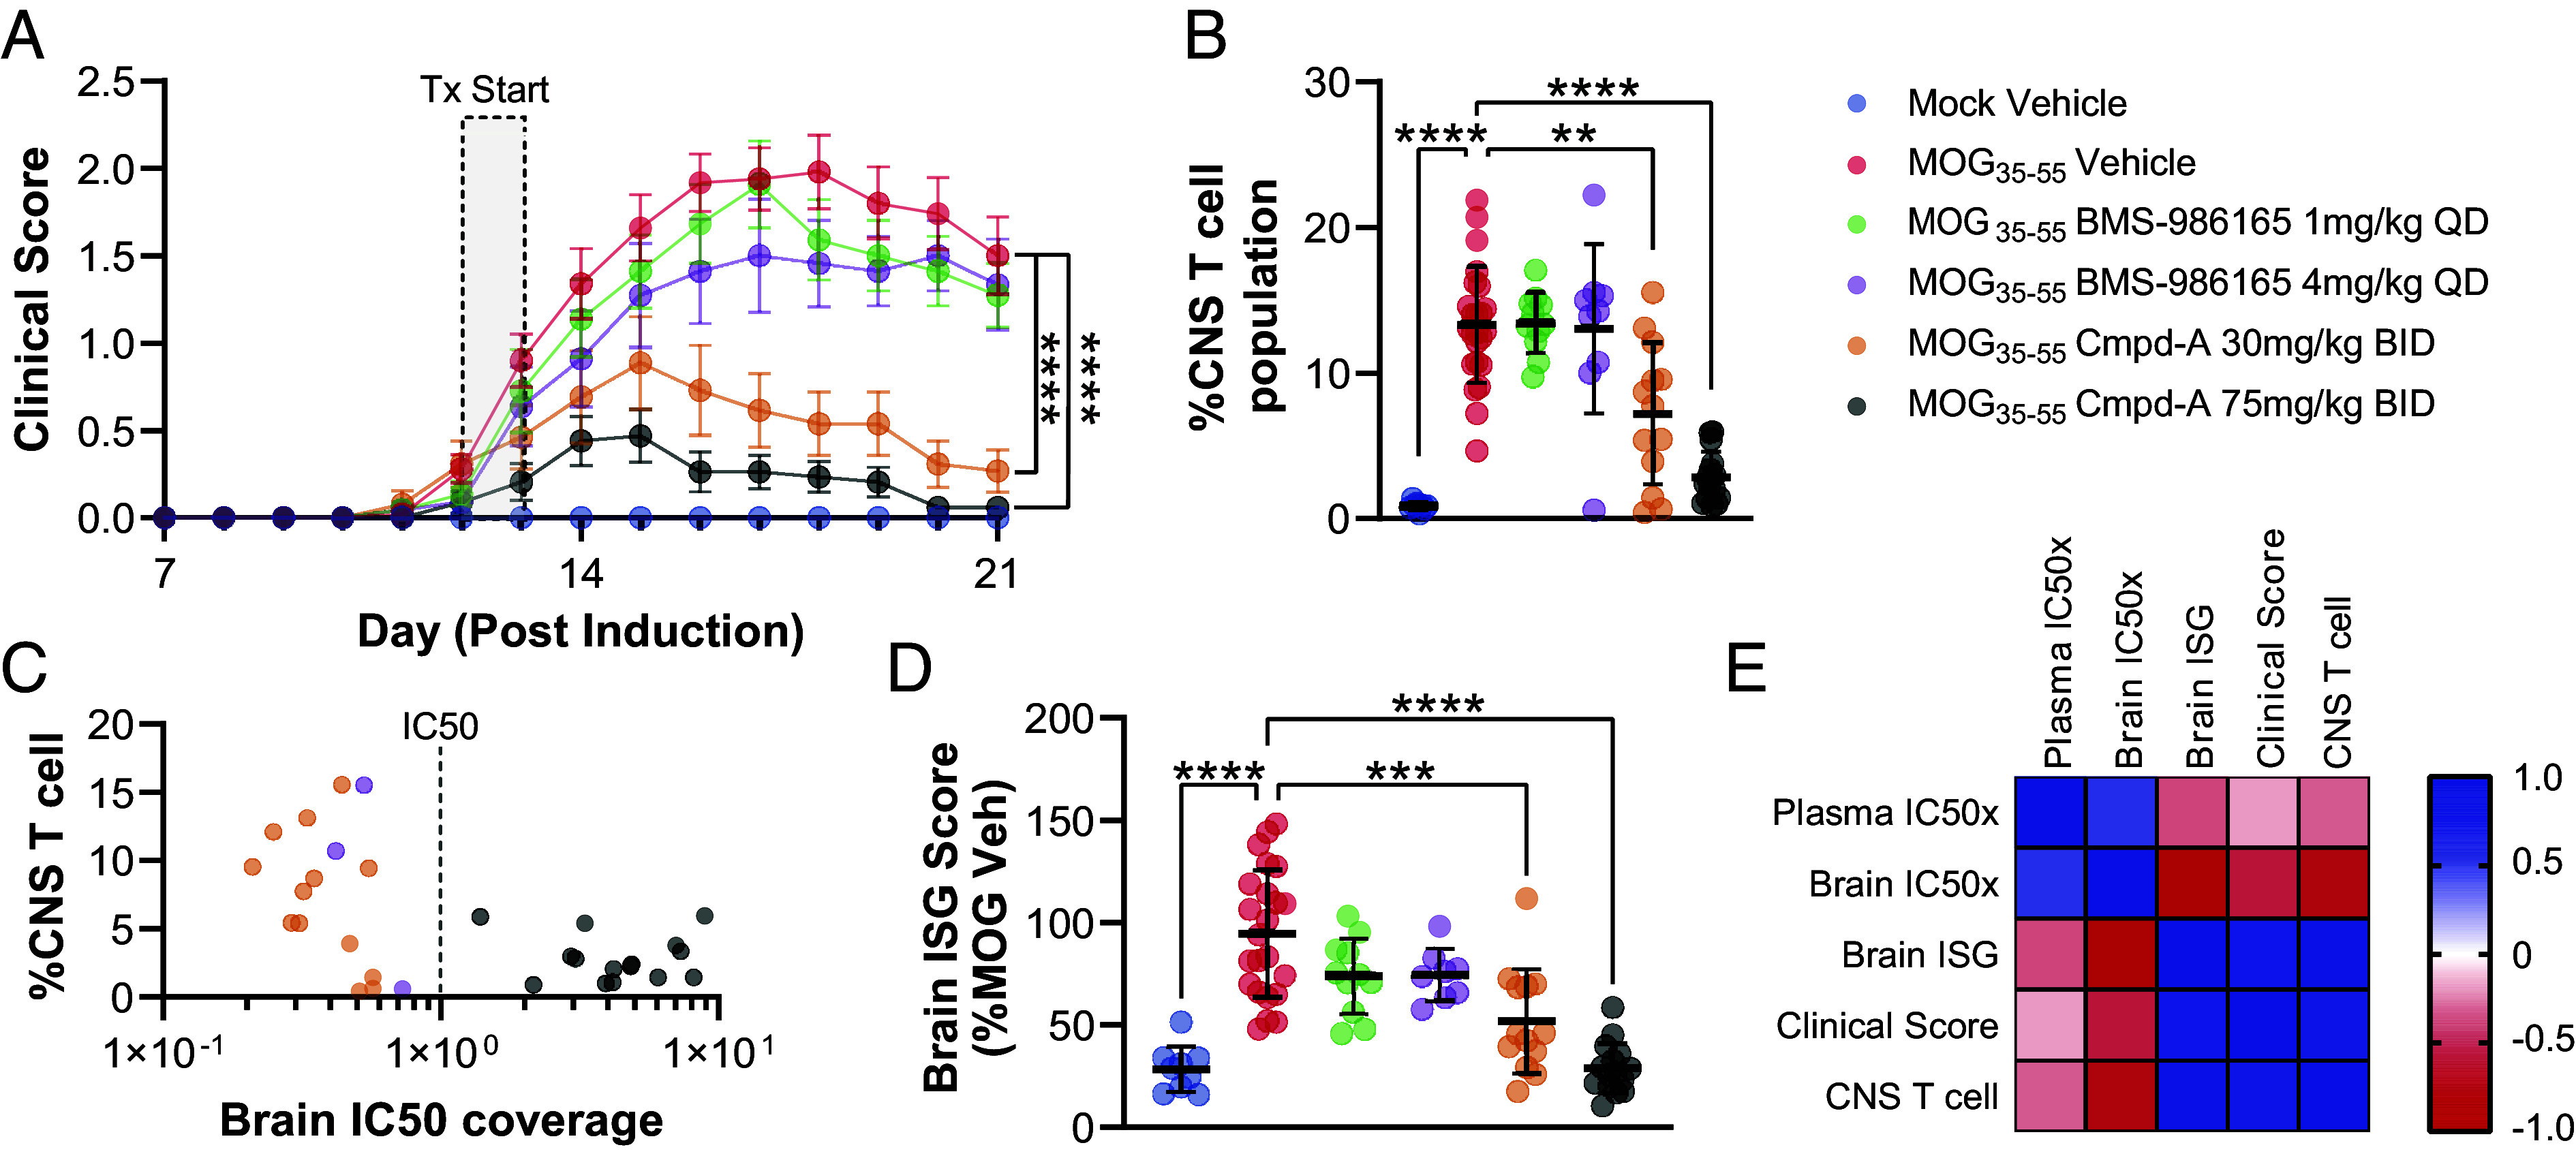
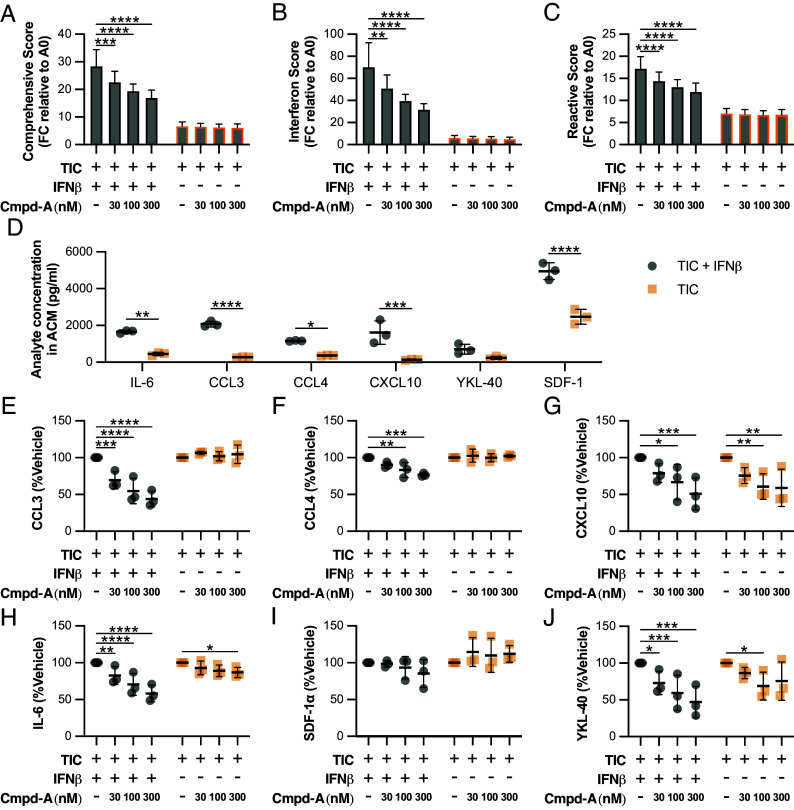
GWAS have identified tyrosine kinase 2 (TYK2) variants in multiple inflammatory disorders, specifically a protective hypomorphic TYK2 allele (P1104A) in multiple sclerosis (MS). Impaired TYK2 signaling within the central nervous system (CNS) may impart the protective effects of TYK2 P1104A allele in MS. We deployed brain-penetrant TYK2 inhibitors (cTYK2i) alongside the peripherally restricted TYK2 inhibitor (pTYK2i; BMS-986165) to untangle the contributions of central TYK2 inhibition in diverse models of neuroinflammation. While pTYK2i had little impact, cTYK2i reduced clinical score, lymphoid cell infiltration, and cytokines/chemokines in experimental autoimmune encephalomyelitis (EAE). Microglial activation was attenuated in cTYK2i-treated EAE spinal cords and circulating neurofilament light (NfL) was reduced in plasma and cerebral spinal fluid (CSF). Additionally, cTYK2i was protective in an antibody-mediated mouse model of primary progressive MS (PPMS). Finally, we demonstrate TYK2 inhibition has a robust impact on a unique subset of activated astrocytes termed Interferon-Responsive-Reactive-Astrocytes (IRRA). The data presented herein identify a key role for CNS TYK2 signaling in regulating neuroinflammation and solidify TYK2 as a potential therapeutic target for MS.

Keywords: EAE; TYK2; autoimmunity; glial cells; neuroinflammation.


Conflict of interest statement

Competing interests statement:Excluding J.K.W., A.E.M., G.L.C., S.M.K., and S.A.S., all remaining authors are employees of Neuron23, Inc. a for profit company. Neuron23, Inc. funded most of the research presented within. Experiments performed in collaboration with the Tisch MS Research Center of New York were executed by Tisch Researchers and funded by Tisch internal funds. Neuron23 Inc. holds the following patents as it relates to compounds that modulate the activity of one or more kinases, such as TYK2 or mutants thereof: US-20230373985-A1, US-20240025906-A1, US20240067655-A1. Characterization of chemical compounds utilized in this study can be found within US patents: US-20230373985-A1, US-20240025906-A1, US-20240067655-A1.

Figures

Fig. 1.
Fig. 1.
Potent, selective, and CNS-penetrant TYK2 inhibitors attenuate IFNα- induced signaling in human iPSC-derived glia and rodent brain. Cellular potency and selectivity for (A) Cmpd-A, (B) Cmpd-B, and (C) BMS-986165 on TYK2, JAK1, and JAK2-dependent signaling pathways in THP-1 cells. n = 4 to 6. IFNα-induced phosphorylation of STAT5 shows TYK2 signaling, IL-6-induced phosphorylation of STAT3 shows JAK1 signaling and GM-CSF-induced phosphorylation of STAT5 shows JAK2 signaling. (D) Total and phosho-TYK2Y1054/1055 immunoblot of from human iPSC-derived astrocyte (iAstro), and microglia (iMG) stimulated with IFNα. Cellular potency of Cmpd-A determined by ELISA against pSTAT3, pSTAT5, and pTYK2Y1054/1055 in iAstro (E) and iMG (F) stimulated by IFNα. Data are presented as mean ± SD from three independent experiments. In vivo target engagement for Cmpd-A, Cmpd-B, and BMS-986165 in IFNα-induced C57BL/6 mice quantified by interferon-stimulated genes (ISG) mRNA expression in (G) spleen and (H) brain, and CXCL10 protein accumulation in (I) plasma and (J) brain. PK/PD relationship for each molecule was visualized by plotting CXCL10 levels against free drug concentrations in (K) plasma and (L) brain. CXCL10 value is represented as percent of vehicle control. Low = low dose group (0.3 mg/kg BMS-986165; 10 mg/kg Cmpd-A and Cmpd-B), Mid = mid dose group (1 mg/kg BMS-986165; 30 mg/kg Cmpd-A and Cmpd-B), High = high dose group (5 mg/kg BMS-986165; 100 mg/kg Cmpd-A and Cmpd-B). IC50 curves were fit using a nonlinear regression model weighted by 1/Y2 assuming normal pharmacology. Each dot represents an independent sample. ROUT test (Q = 1%) used to eliminate outliers. Bars represent mean ± SD. Statistical analysis was calculated using one-way ANOVA with Dunnett’s multiple comparisons test.
Fig. 2.
Fig. 2.
Central TYK2 inhibition is protective by semitherapeutic delivery in the MOG35-55 EAE mouse model. (A) Clinical score for mock or MOG35-55 induced animals treated with vehicle, BMS-986165, or Cmpd-A, n = 9 to 24. Bars represent mean ± SEM and statistical analysis compares to cumulative clinical score of MOG35-55 EAE vehicle group. (B) CNS T cell population represented as % of total live cells following dissociation as determined by flow cytometry. (C) Correlations between CNS T cell population and brain IC50 coverage of tested compounds. (D) Brain ISG score. Bars represent mean ± SD and the data are representative of four independent experiments. Each dot represents an individual animal (E) Correlation heatmap comparing target coverage (IC50x), brain ISG, clinical score, and CNS T cell population. Statistical analysis compares to MOG EAE vehicle group using one-way ANOVA with Dunnett’s multiple comparisons test, Brown–Forsythe, or Welch ANOVA with Dunnett’s T3 multiple comparison test based on data distribution.
Fig. 3.
Fig. 3.
Central TYK2 inhibition is protective by therapeutic delivery in the MOG1-125 EAE mouse model. (A) Clinical score was recorded daily for mock or MOG1-125 induced animals treated with vehicle, BMS-986165, or Cmpd-B. Bars represent mean ± SEM from two independent experiments and statistical analysis compares to cumulative clinical score of MOG1-125 EAE vehicle group, n = 10 to 11. (B) Endpoint open field motor test. (C) CNS T cell and (D) B cell population are represented as % of total live cells. Bars represent mean ± SD and the data are representative of two independent experiments (E) Correlation heatmap comparing target coverage, brain ISG, clinical score, and CNS T or B cell population. (F) Plasma levels of anti-MOG1-125 IgG. Bars represent mean ± SD. Each dot represents an independent animal. Statistical analysis compares MOG EAE vehicle groups to all other groups using one-way ANOVA with Dunnett’s multiple comparisons test.
Fig. 4.
Fig. 4.
Central TYK2 inhibition reduces demyelination and gliosis in the MOG1-125 EAE mouse model. Representative brightfield images and quantifications for cervical spinal cord coronal sections immunohistochemically stained for (A) GFAP, (B) Iba1 and (C) MBP in mock or MOG1-125 induced animals treated with vehicle, BMS-986165, or Cmpd-A. MBP stain is counterstained with Neutral Red (NR). Percent area measurements are relative to total tissue area per ample. Bars represent mean ± SD from two independent experiments. Each dot represents an independent animal. Statistical analysis compares MOG EAE vehicle groups to all other groups using one-way ANOVA with Dunnett’s multiple comparisons test.
Fig. 5.
Fig. 5.
Central TYK2 inhibition attenuates transcriptional inflammatory program and biomarker expression in EAE mouse models. MOG35-55 (A) IFN and (B) NF-κB mediated whole brain mRNA expression and, MOG1-125 (C) IFN and (D) NF-κB mediated whole brain mRNA expression represented as heat map of median Log2 fold change (Log2FC) relative to Mock vehicle group, n = 5 to 24. The relative levels of (E) CXCL10, (F) IL-16, and (G) CCL3 in the spinal cord tissue from Mock, MOG EAE induced animals treated with vehicle, BMS-986165, Cmpd-A, or Cmpd-B. Results are reported as relative levels to the EAE vehicle group per experiment and represent mean ± SD. Each dot represents an independent animal. (H) Cytokine and chemokine correlation to clinical score and CNS T cell population in MOG EAE models. Statistical analysis compares to MOG EAE vehicle group using one-way ANOVA with Dunnett’s multiple comparisons test, Brown–Forsythe, and Welch ANOVA with Dunnett’s T3 multiple comparison test or Kruskal–Wallis with Dunn’s multiple comparison based on data distribution.
Fig. 6.
Fig. 6.
Pathogenic rAb derived mouse model of PPMS rescued by prophylactic central TYK inhibition. (A) Schematic summarizing method of disease induction by administration of rAb derived from CSF B cells of PPMS patient. (B) Motor deficit score reported on days 1 and 3. Bars represent mean ± SEM. Each dot represents an independent animal (n = 6). (C) Normalized grip strength reported on days 1 and 3. Representative images and quantification for spinal cord (D) GFAP, (E) Iba1, and (F) SMI-32 staining. Bars represent mean ± SD. Each dot represents an independent animal. Statistical analysis was calculated using two-way ANOVA or unpaired two-tailed t test.
Fig. 7.
Fig. 7.
NfL Biomarker correlates with disease severity in gpMBP69-88 EAE rat model. (A) Clinical score was recorded daily for mock or MBP EAE induced animals treated with vehicle, BMSf-986165, or Cmpd-A, n = 8 to 16. Bars represent mean ± SEM and statistical analysis compares to cumulative clinical score of gpMBP69-88 EAE vehicle group. (B) cNfL quantification and (C) correlation to clinical score. (D) pNfL quantification and (E) correlation to cNfL. Bars represent mean ± SD from two independent experiments. Each dot represents an independent animal. Statistical analysis compares to gpMBP69-88 EAE vehicle group using the Kruskal–Wallis test with Dunn’s multiple comparisons test.
Fig. 8.
Fig. 8.
Differential effects of TYK2 inhibition on iPSC-derived reactive astrocyte models. (A) Comprehensive, (B) Interferon, and (C) Reactive gene expression scores from two iPSC-derived reactive astrocyte models treated with TYK2 inhibitor for 48 h. Scores represent the geometric mean of fold change across all genes tested relative to unstimulated cells. (D) Comparison of secreted cytokines in astrocyte-conditioned medium across iPSC-derived astrocyte models. Relative levels of (E) CCL3, (F) CCL4, (G) CXCL10, (H) IL-6, (I) SDF-1α, and (J) YKL-40, with DMSO or Cmpd-A at poststimulated 48 h. Each dot represents an independent sample. Bars represent ± SD from three independent experiments and statistical significance was calculated using two-way ANOVA.

References

    1. Banerjee S., Biehl A., Gadina M., Hasni S., Schwartz D., JAK–STAT signaling as a target for inflammatory and autoimmune diseases: Current and future prospects. Drugs 77, 521–546 (2017). - PMC - PubMed
    1. Jensen L. T., Attfield K. E., Feldmann M., Fugger L., Allosteric TYK2 inhibition: Redefining autoimmune disease therapy beyond JAK1-3 inhibitors. EBioMedicine 97, 104840 (2023), 10.1016/j.ebiom.2023.104840. - DOI - PMC - PubMed
    1. Pellenz F. M., et al. , Association of TYK2 polymorphisms with autoimmune diseases: A comprehensive and updated systematic review with meta-analysis. Genet Mol. Biol. 44, e20200425 (2021), 10.1590/1678-4685-gmb-2020-0425. - DOI - PMC - PubMed
    1. Tao J.-H., et al. , Meta-analysis of TYK2 gene polymorphisms association with susceptibility to autoimmune and inflammatory diseases. Mol. Biol. Rep. 38, 4663–4672 (2011). - PubMed
    1. Wrobleski S. T., et al. , Highly selective inhibition of tyrosine kinase 2 (TYK2) for the treatment of autoimmune diseases: Discovery of the allosteric inhibitor BMS-986165. J. Med. Chem. 62, 8973–8995 (2019). - PubMed

MeSH terms

LinkOut - more resources