. 2025 Apr;122(13):e2424046122.
doi: 10.1073/pnas.2424046122. Epub 2025 Mar 24.

Control of circadian muscle glucose metabolism through the BMAL1-HIF axis in obesity

Affiliations

Control of circadian muscle glucose metabolism through the BMAL1-HIF axis in obesity

Claire A Chaikin et al. Proc Natl Acad Sci U S A. 2025 Apr.

Abstract

Disruptions of circadian rhythms are widespread in modern society and lead to accelerated and worsened symptoms of metabolic syndrome. In healthy mice, the circadian clock factor BMAL1 is required for skeletal muscle function and metabolism. However, the importance of muscle BMAL1 in the development of metabolic diseases, such as diet-induced obesity (DIO), remains unclear. Here, we demonstrate that skeletal muscle-specific BMAL1-deficient mice exhibit worsened glucose tolerance upon high-fat diet feeding, despite no evidence of increased weight gain. Metabolite profiling from Bmal1-deficient muscles revealed impaired glucose utilization specifically at early steps in glycolysis that dictate the switch between anabolic and catabolic glucose fate. We provide evidence that this is due to abnormal control of the nutrient stress-responsive hypoxia-inducible factor (HIF) pathway. Genetic HIF1α stabilization in muscle Bmal1-deficient mice restores glucose tolerance and expression of 217/736 dysregulated genes during DIO, including glycolytic enzymes. Together, these data indicate that during DIO, skeletal muscle BMAL1 is an important regulator of HIF-driven glycolysis and metabolic flexibility, which influences the development of high-fat-diet-induced glucose intolerance.

Keywords: circadian rhythm; diet-induced obesity; hypoxia; skeletal muscle.


Conflict of interest statement

Competing interests statement:The authors declare no competing interest.

Figures

Fig. 1.
Fig. 1.
Loss of skeletal muscle BMAL1 leads to impaired glucose tolerance with no evidence of worsened insulin sensitivity. (A) Experimental design. (B) Resting glucose and lactate values for mice during HFD feeding. (C) Intraperitoneal glucose tolerance test (IPGTT) was performed on mice at 13 wk of HFD by administering glucose (1 g/kg) via IP injection after a 6-h fast at ZT2 (early inactive period). The IPGTT curve shows change in blood glucose levels following glucose administration at 0, 15, 30, 60, and 120 min beginning at ZT2 and corresponding Area Under the Curve analyses. (D) IPGTT curve with baseline glucose values subtracted and corresponding Area of the Curve analysis. (E) Fasting glucose measurements taken after the 6-h fast before glucose injection at ZT2. (F) Serum insulin values at 0 and 15 min of the ZT2 IPGTT. (G) Western blot showing insulin signaling protein levels in gastrocnemius muscles from male Control and Bmal1mKO mice fed an HFD for 22 wk. n = 8 to 9 (Control) and n = 4 to 5 (Bmal1mKO). Data are represented as ± SEM. (*P < 0.05).
Fig. 2.
Fig. 2.
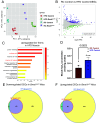
Transcriptomic changes in skeletal muscle during HFD feeding with and without BMAL1. (A) Principal component analysis (PCA) plot for RC and HFD male Control and Bmal1mKO mice. (B) MA plot showing DEGs (adj P-value < 0.01) in skeletal muscle between RC and HFD Control mice. (C) GO analysis of upregulated DEGs between RC and HFD Control mice. (D) ROS concentrations (H2O2) from quadriceps muscle in RC and HFD Control mice. (E and F) Venn diagram showing the overlap of up/downregulated genes from RC Control vs RC Bmal1mKO and HFD Control vs HFD Bmal1mKO mice and subsequent Kyoto Encyclopedia of Genes and Genomes (KEGG) analysis of overlapping up/downregulated genes. n = 4 (RC Control), n = 3 (RC Bmal1mKO), n = 7 to 8 (HFD Control), and n = 4 to 5 (HFD Bmal1mKO).
Fig. 3.
Fig. 3.
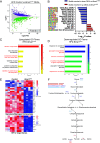
Transcriptomic changes in skeletal muscle in the absence of BMAL1 during DIO. (A) MA plot showing DEGs (adj P-value < 0.01) in skeletal muscle between HFD Control and Bmal1mKO mice. (B) HOMER Motif analysis on up- and downregulated DEGs in Bmal1mKO mice. (C and D) GO analysis was performed on up- and downregulated DEGs in Bmal1mKO mice. (E) Heatmaps showing genes which are differentially expressed between Control and Bmal1mKO mice that are part of glycolysis/glycogen homeostasis and HIF1α target genes. (F) Schematic showing intermediates of glycolysis and related genes which were found to be differentially expressed in Bmal1mKO mice. n = 8 (Control) and n = 4 (Bmal1mKO).
Fig. 4.
Fig. 4.
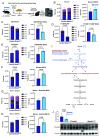
Loss of skeletal muscle BMAL1 alters glycolytic metabolite levels. (A) 13C6-glucose bolus experimental design. (B) Total and M + 6 labeled glucose levels in gastrocnemius muscle from HFD male Control and Bmal1mKO mice. (C) Total and M + 6 labeled fructose-6-phosphate/glucose-6-phosphate/glucose-1-phosphate. (D) Total and M + 6 labeled fructose 1,6-bisphosphate/fructose 2,6-bisphosphate. (E) Total and M + 3 labeled glyceraldehyde 3-phosphate/dihydroxyacetone phosphate. (F) Total and M + 3 labeled alanine. (G) Total and M + 6 labeled glucose levels in serum from HFD male Control and Bmal1mKO mice. (H) Total and M + 3 labeled alanine levels in serum. (I) Schematic showing intermediates of glycolysis, which metabolites show significant or trending altered levels in Bmal1mKO mice, and corresponding genes which are differentially expressed. n = 4 (Control), n = 5 (Bmal1mKO). Serum, n = 5 (Control), n = 3 (Bmal1mKO). (J) Western blot and quantification of PFKFB3 in gastrocnemius muscles from HFD Control and Bmal1mKO mice. n = 8 (Control) and n = 4 (Bmal1mKO). Data are represented as ± SEM.
Fig. 5.
Fig. 5.
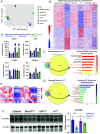
HIF1α stabilization rescues a subset of DEGs in Bmal1mKO during DIO. RNA sequencing was performed on gastrocnemius muscles from Bmal1 Control, Bmal1mKO, Vhl Control, VhlmKO, d Control, and dmKOmice, and DEGs were identified at adj P-value < 0.01. (A) PCA plot for all genotypes sequenced. (B) Heatmap showing up- and downregulated DEGs in the Bmal1mKO condition and expression of those genes in the other genotypes with manual clustering to visualize restored and rescued genes. (C) Venn diagram showing genes upregulated in Bmal1mKO mice and rescued (not differentially expressed or upregulated) in dmKO mice and KEGG analysis of rescued genes. (D) Normalized counts (from edgeR) for select genes which were rescued in dmKO mice. (E) Normalized counts (from edgeR) for select important downregulated glycolytic genes from Bmal1mKO and their levels in dmKO. (F) Western blot and quantification of PFKFB3 from gastrocnemius muscles from HFD Control, Bmal1mKO, VhlmKO, and dmKO mice. (G) Venn diagram showing genes upregulated in Bmal1mKO mice and restored (not differentially expressed or downregulated) in dmKO mice and GO analysis of restored genes. n = 8 (Bmal1 Control), n = 6 (Vhl Control, d Control), and n = 4 (Bmal1mKO, VhlmKO, dmKO). Data are represented as ± SEM. (*P < 0.05).
Fig. 6.
Fig. 6.
HIF1α stabilization improves glucose tolerance in Bmal1mKO during DIO. (A) Experimental design. (B) Body weight and weight gain for male Vhl Control, VhlmKO, d Control, and dmKO mice fed an HFD for 22 wk at 22 °C. (C) Body composition analysis measured by EchoMRI at 12 wk of HFD. (D and E) Resting glucose and lactate values for mice during HFD feeding. (FK) Oral Glucose Tolerance Test (oGTT) was performed on mice at 18 wk of HFD by administering glucose (2 g/kg) via oral gavage. The oGTT curve shows change in blood glucose levels following glucose administration at 0, 15, 30, 60, and 120 min beginning at ZT2. (G) oGTT curve with baseline glucose values subtracted and corresponding Area Of the Curve analysis for Vhl Control and VhlmKO mice. (H) Fasting glucose measurements taken after the 4-h fast before glucose injection at ZT2 for Vhl Control and VhlmKO mice. (I–K) oGTT curve, oGTT curve with baseline glucose values subtracted and Area Of the Curve analysis, and fasting glucose measurements for d Control and dmKO mice. n = 6 (Vhl Control, d Control, dmKO) and n = 4 (VhlmKO). Data are represented as ± SEM. (*P < 0.05, **P < 0.01, and ***P < 0.001).

References

    1. Bass J., Lazar M. A., Circadian time signatures of fitness and disease. Science 354, 994–999 (2016). - PubMed
    1. Bass J., Takahashi J. S., Circadian integration of metabolism and energetics. Science 330, 1349–1354 (2010). - PMC - PubMed
    1. Buhr E. D., Takahashi J. S., Molecular components of the mammalian circadian clock. Handb Exp. Pharmacol. 15, R271–R277 (2013), 10.1007/978-3-642-25950-0_1. - DOI - PMC - PubMed
    1. Schibler U., et al. , Clock-talk: Interactions between central and peripheral circadian oscillators in mammals. Cold Spring Harb. Symp. Quant Biol. 80, 223–232 (2015). - PubMed
    1. Roenneberg T., Allebrandt K. V., Merrow M., Vetter C., Social jetlag and obesity. Curr. Biol. 22, 939–943 (2012). - PubMed

LinkOut - more resources